Fig. 5
Download original image
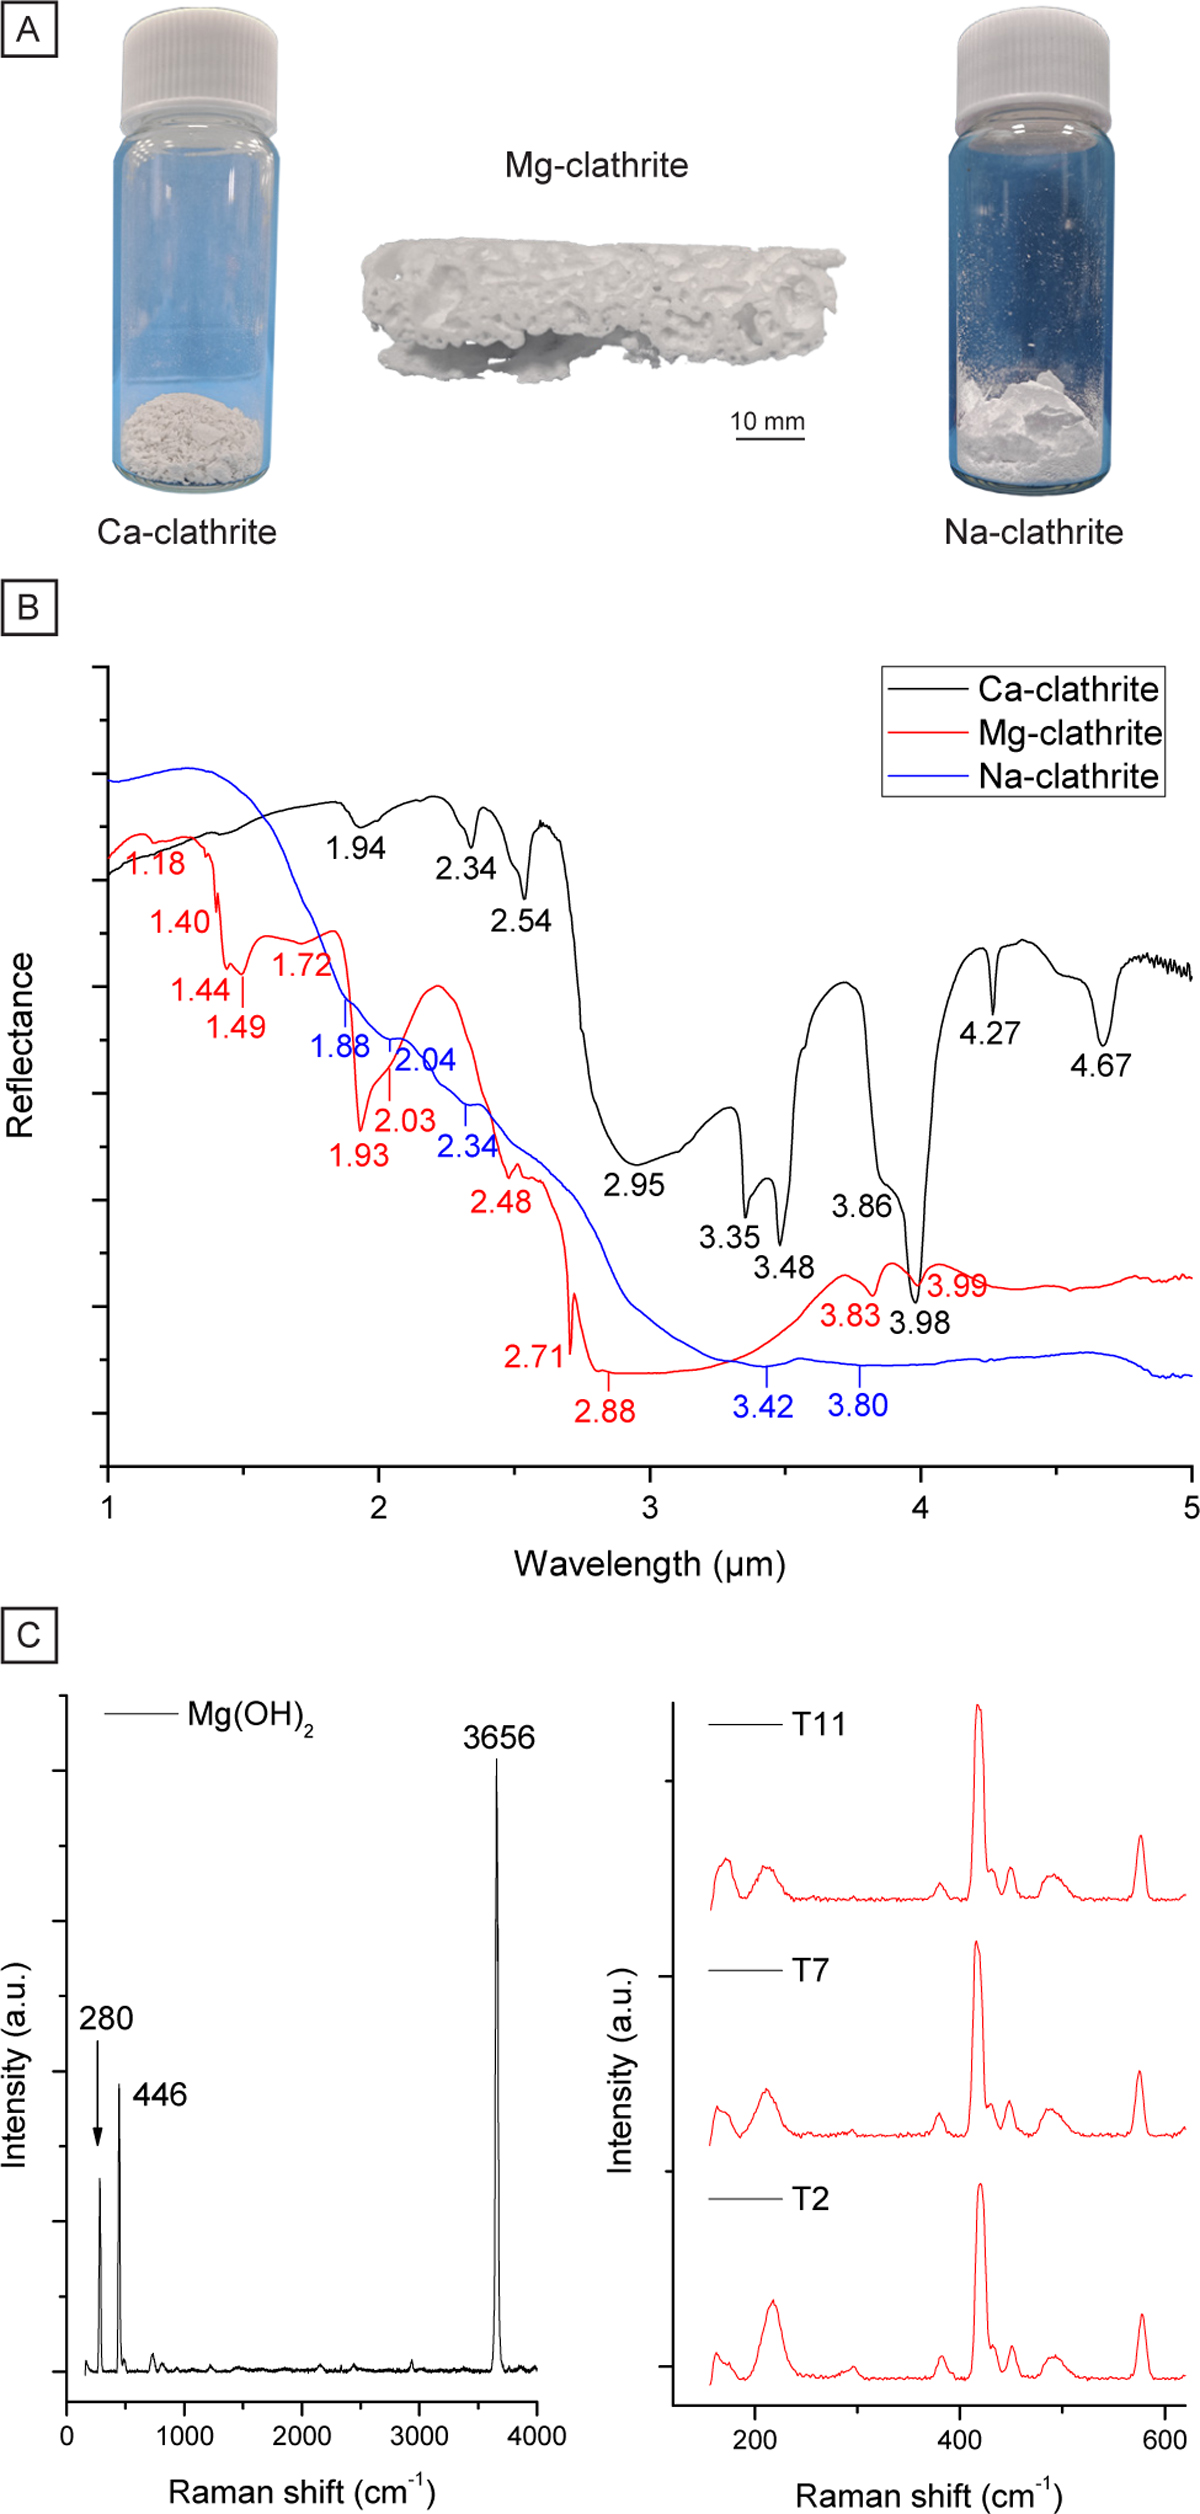
Characterisation of the clathrite samples. (A) Images of the three synthesised clathrites. (B) Near-IR spectra of Ca-clathrite (black line), Mg-clathrite (red line), and Na-clathrite (blue line). (C) Characteristic Raman peaks of MgOH used in the Mg-clathrite synthesis experiment (left). Raman spectra of Mg-clathrite in formation at three different times. The disappearance of the peak around 280 cm−1 indicates the depletion of the initial MgOH (right).
Current usage metrics show cumulative count of Article Views (full-text article views including HTML views, PDF and ePub downloads, according to the available data) and Abstracts Views on Vision4Press platform.
Data correspond to usage on the plateform after 2015. The current usage metrics is available 48-96 hours after online publication and is updated daily on week days.
Initial download of the metrics may take a while.