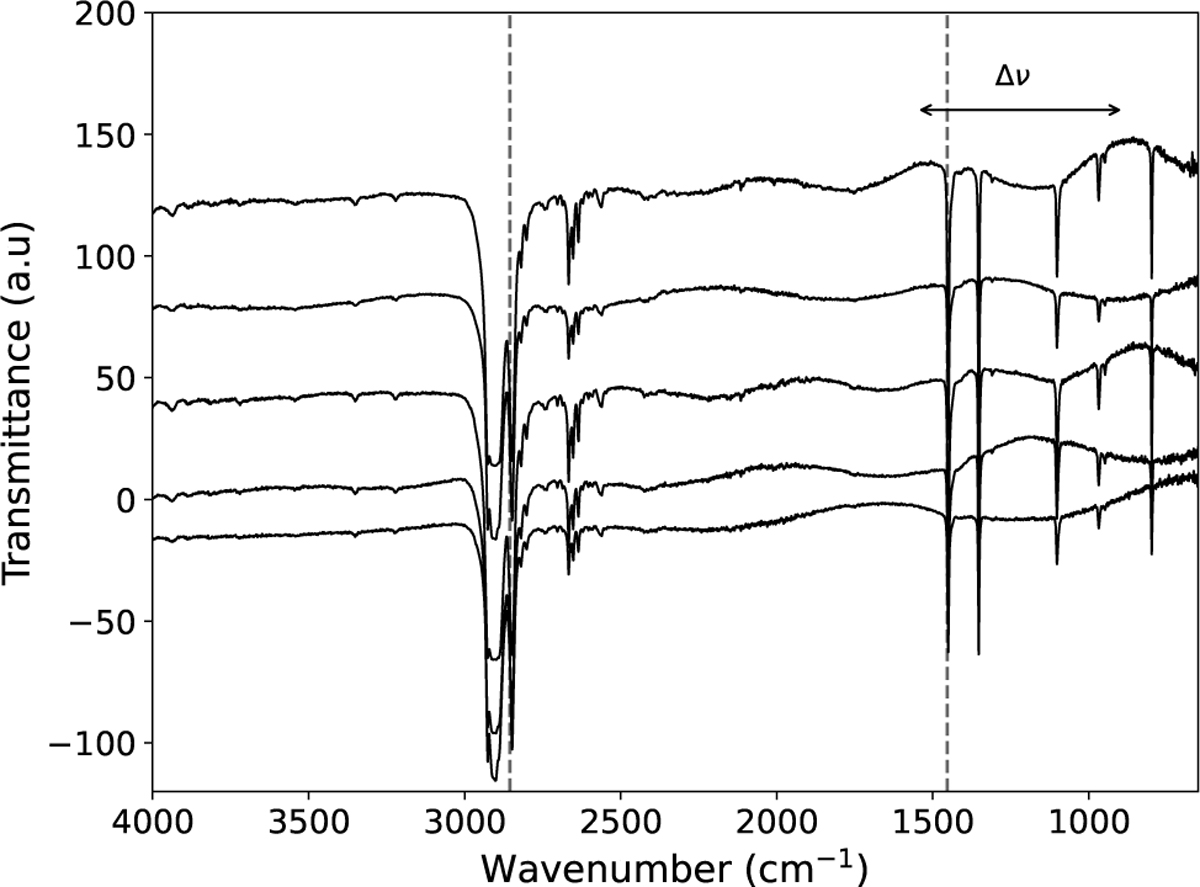
Fig. A.1
Download original image
IR transmittance spectra taken of adamantane thin films of various thicknesses. This difference in thickness between samples leads to the appearance of interference fringes of different lengths. The dashed lines indicate the two IR bands at 2855 and 1454 cm−1 of which we are interested to determine the band strengths. Δν represents an example of the fringe length of the upper spectra which is used in the calculations to determine the local film thickness. The spectra are vertically shifted for clarity.
Current usage metrics show cumulative count of Article Views (full-text article views including HTML views, PDF and ePub downloads, according to the available data) and Abstracts Views on Vision4Press platform.
Data correspond to usage on the plateform after 2015. The current usage metrics is available 48-96 hours after online publication and is updated daily on week days.
Initial download of the metrics may take a while.