| Issue |
A&A
Volume 703, November 2025
|
|
|---|---|---|
| Article Number | A246 | |
| Number of page(s) | 8 | |
| Section | Interstellar and circumstellar matter | |
| DOI | https://doi.org/10.1051/0004-6361/202556030 | |
| Published online | 21 November 2025 | |
Cosmic ray interactions with indene and adamantane seeded water ice mantles
1
Institut des Sciences Moléculaires d’Orsay (ISMO), UMR8214, CNRS, Université Paris-Saclay,
91405
Orsay,
France
2
Laboratoire de physique des deux infinis Irène Joliot-Curie, CNRS-IN2P3, Université Paris-Saclay,
91405
Orsay,
France
3
Centre de Recherche sur les Ions, les Matériaux et la Photonique, CIMAP-CIRIL-GANIL, Normandie Université, ENSICAEN, UNICAEN, CEA, CNRS,
14000
Caen,
France
4
Dipartimento di Fisica, Università di Trento,
Trento
38123,
Italy
★ Corresponding author: This email address is being protected from spambots. You need JavaScript enabled to view it.
Received:
19
June
2025
Accepted:
16
September
2025
Abstract
Context. Indene is among the first polycyclic aromatic hydrocarbon (PAH) species detected in the gas phase in the Taurus molecular cloud (TMC-1), with high abundances for such a complex organic molecule (COM). Considering the conditions of these dense clouds, and the timescales of the processes at play, there have to be mechanisms driving the desorption of molecules to maintain a high level of gas phase species; otherwise, most of them should condense on dust grains when approaching the cloud core. On the other hand, detections of diamond features in young stellar objects have been reported, sparking interest in diamondoid species such as the cage molecule adamantane.
Aims. We investigate and quantify the importance of cosmic rays in the sputtering and radiolysis of COMs such as indene and adamantane and the potential release of species from the solid phase.
Methods. Ice films made of indene and adamantane mixed with water and deposited at 9 K were exposed to a 40 MeV 56Fe10+ ion beam at the heavy-ion accelerator Grand Accélérateur National d’Ions Lourds (GANIL; Caen, France). Both infrared and quadrupole mass spectrometer measurements were recorded simultaneously throughout the irradiation, enabling the sputtering efficiencies and the radiolysis cross sections of the species to be determined.
Results. The intact-to-solid sputtered ratios and the radiolysis cross sections of indene and adamantane were determined. By combining these results with astrophysical models, the expected fraction of indene in the solid phase that would be required to explain the gas phase abundance by this process was calculated with respect to the depth in the cloud and compared to current gas phase abundances observed in TMC-1.
Key words: astrochemistry / solid state: volatile / methods: laboratory: solid state / ISM: abundances / cosmic rays / ISM: molecules
© The Authors 2025
 Open Access article, published by EDP Sciences, under the terms of the Creative Commons Attribution License (https://creativecommons.org/licenses/by/4.0), which permits unrestricted use, distribution, and reproduction in any medium, provided the original work is properly cited.
This article is published in open access under the Subscribe to Open model. This email address is being protected from spambots. You need JavaScript enabled to view it. to support open access publication.
1 Introduction
In dense regions of space, the local temperature is low, and any molecule and/or radical apart from the smaller and lighter ones has a high sticking coefficient on dust grains. Their freeze-out is therefore related to the local density, and condensation timescales can get extremely short with respect to typical cloud lifetimes reaching tens of millions of years (Chevance et al. 2020), whereas gas phase species are still observed with relatively high abundances in these environments at densities of n(H2) > 104-5 cm−3, meaning that they have either lasted longer than these shorter timescales or been recently produced or injected in the gas phase (Belloche et al. 2020; Dartois et al. 2019; Lefloch et al. 2018). Physico-chemical processes play a role in the formation and/or release of these observed gas phase species. In that matter, to better model interstellar chemistry and follow its evolution, it is crucial to understand the relative contribution of interfering energetic processes, mainly the desorption mechanisms. In fact, interstellar grains and ices are subject to cosmic rays (CRs), i.e. mega-electronvolt-tera-electronvolt energetic ionic species mainly from protons to iron. The recently observed high abundances of gaseous polycyclic aromatic hydrocarbon (PAH) species such as indene (∼0.96-1.6 × 10⁻⁹ n(H2) Burkhardt et al. 2021; Cernicharo et al. 2021) are difficult to sustain using the current astrochemical models. In parallel, it has been estimated by Maté et al. (2023) that, based on the 3.3 μm weak absorption reported for Elias 16 (V 892 Tau, a young stellar object in the Taurus dark cloud complex), indene in the ice mantles could make up to ∼2% of the cosmic carbon, a seemingly unrealistic value.
It has been suggested that cyclization including a pentagon, such as in indene, is accessible at low temperatures in the gas phase from methylidine addition to styrene (Doddipatla et al. 2021). However, even if two-cycle PAHs can be produced, it is still difficult to explain how maintaining such large species in the gas phase, in a relatively high fractional abundance, is possible in dense regions, as they should rapidly condense on the cold dust grains, requiring a rather high formation rate. This effect becomes further constrained when considering larger species.
Despite it not being detected in the ISM yet, adamantane’s relevancy in the astrophysical context comes from its structure as the building block for diamondoids. Analogous to what benzene is for PAHs, adamantane is the smallest cage molecule, which paves the way for the synthesis of larger ones. From an observational point of view, micro- and nano-diamonds were detected in meteorites of extrasolar origin (Anders & Zinner 1993). In addition, it was suggested that the detection of an emission feature falling around 3.5 microns originating in HD 97048 and Elias 1 close to the exciting star, favored assignments of diamondoid species as their strongest feature is the C-H stretch appearing at 3.47 microns (Guillois et al. 1999). Further detections of diamond features in HD 97048 as well as in HD 100546 were reported in Habart et al. (2006). Thus, it is interesting to study this molecule’s behavior under exposure to energetic processes.
Astrochemical models provide a way to test the influence of several desorption processes, and assess their relative importance as a function of depth in dense regions, some including CR irradiation (e.g. Wakelam et al. 2021, and references therein). Thus, experimental data of the sputtering and desorption of certain molecules is crucial to feed these models. The irradiation of laboratory ice analogs with swift heavy ions provides important information for experimental simulations of the impact of CRs and can be used to quantify the sputtering rates and include them in astrophysical models.
The rate of sputtering and release of condensed species, large enough that a single photon excitation may not be enough to photodesorb them directly, is an important aspect of interstellar chemistry. In the absence of such mechanisms, the whole gas phase would have to condense in times often shorter than the lifetime of the considered medium, in particular for dense clouds. The recent detection of cyclic aromatic molecules by radioastronomy therefore requires an understanding of the potential mechanisms behind the rather high abundances observed and their efficiencies.
In this article, we experimentally explore the sputtering efficiency and the radiolysis cross section for two large species, indene and adamantane, seeded into a water ice matrix. The experiments are described in the following section, including sample preparation and irradiation by accelerated heavy ions. The evolution of the ices under the effect of this bombardment is explained in Section 3. We discuss the outcome of these measurements in the astrophysical context in Section 4 before concluding.
2 Experiments
Swift ion irradiation experiments were performed at the heavyion accelerator Grand Accélérateur National d'Ions Lourds (GANIL; Caen, France). Heavy ion projectiles were delivered on the IRRSUD beam line. The beam line is coupled to the IGLIAS (Irradiation de GLaces d'Intérêt AStrophysique) setup, a vacuum chamber (10-9 mbar under our experimental conditions) holding an infrared (IR)-transmitting ZnSe window that was cryocooled down to about 9 K. Further details of the experimental setup can be found in (Augé et al. 2018). Indene and adamantane ice films were obtained by positioning the window in front of a deposition line. Indene is a commercial liquid (Sigma-Aldrich, purity >99%, used as provided), with a vapor pressure of 2.3 mbar at room temperature. Adamantane is a commercial powder (Sigma-Aldrich, purity >99%, used as provided), with a vapor pressure of 1.2 mbar at room temperature. Each species was introduced with water into the evacuated gas line to be mixed at the desired ratio, and then injected in the chamber. For indene, two mixtures were made: 1:100 and 12:100 of indene with respect to water. As for adamantane, one mixing ratio of 4:100 was studied.
Deposited ice samples were irradiated at a normal incidence with a 39.3 MeV 56Fe10+ ion beam. In the electronic stopping power regime such as the one expected for galactic cosmic rays (GCRs), radiolysis scales with a Z exponent often slightly above 2 (Chabot 2016), making the radiolysis effect important for CRs from the low-mass H and He, and also, depending on the exponent, from heavier ion contributions (see Fig. 1 in Dartois et al. (2023). However, in terms of electronic sputtering, the yield is proportional to the square of the stopping power and thus to Z4. Hence, higher-mass CRs (C to Ni) dominate the sputtering yield. In addition, at such high energies, the expected ratio of energy deposited in the nuclear regime is far below the one deposited in the electronic regime (in our case Sn/Se ~ 10−3). Therefore, despite the lower abundance of Fe ions with respect to low-mass CR (Fe/H ~ 7 × 10⁻⁴, Meyer et al. (1998), they contribute significantly to the sputtering. Thus, having a good sputtering yield measurement with Fe as an anchor point, combined with a flux distribution of GCR (e.g. Shen et al. (2004) and the corresponding stopping power scaling law, we are able to deduce the sputtering yield for a given CR flux distribution. This is discussed with respect to the water ice matrix in §4. The ion flux, set between 107 and 109 ions/(cm2 s), is monitored in real time by measuring the current at the beam entrance slits, which define the aperture. A sweeping device ensures consistent and uniform ion irradiation across the target surface. Prior to each experiment, the correlation between the current at various slit apertures and the ion flux is calibrated using a Faraday cup positioned in front of the sample chamber.
The monitoring of the IR film transmittance was performed with an FTIR spectrometer (Bruker Vertex 70v) at a spectral resolution of 1 cm−1, at an incidence angle of 12° (thus, a correction of 0.978 had to be taken into account when calculating column densities from the IR signal). IR spectra are recorded as a function of the ion fluence to follow their evolution. In parallel, gas-phase species were analyzed by an MKS Microvision quadrupole mass spectrometer (QMS).
The stopping power in the electronic regime for the beam used in this experiment, incident on a pure water ice film, was calculated to be Se = 4.704 × 10² eV/(1015 atoms/cm2) with a projected ion range greater than 10 microns, using the SRIM package (Ziegler et al. 2010). The latter value is in agreement with the almost constant energy loss of ions for thin films produced in our experiments, which are on the order of hundreds of nanometers thick.
3 Results and analysis
3.1 Indene
3.1.1 Indene:Water (1:100)
A mixture of indene and water with a ratio of ~1:100 was irradiated. The ratio, calculated from the intensity of the species’ IR features, denotes a number ratio of indene to water molecules. The same definition of the ratio applies for the following experiments. The evolution of the column density ratio of the species, determined from the IR signal with respect to the fluence, is shown in Fig. 1. For water, the broad OH stretching mode at around 3300 cm−1 was used in this calculation. As for indene, two features at 1458 cm−1 and 1393 cm−1 were analyzed. These bands correspond to the δ in-phase in-plane 3 CH hexa-ring and δ CH2 of band strengths 6.4 and 5.1 × 10⁻¹⁸ cm molecule−1, respectively (Maté et al. 2023). Two new features appear in the range of 2500-2000 cm−1 corresponding to two radiolysis products, CO and CO2. The CO stretch appears at around 2140 cm−1, whereas that of CO2 is at 2350 cm−1. Simultaneous QMS measurements allowed us to determine the gas-phase composition induced by sputtering. Two masses from the pure indene mass fragmentation pattern were chosen for indene: m/z = 115 and 89, corresponding to C9H+7, the H-loss of indene, and to C7H+5, respectively, due to them having a high signal-to-noise ratio (S/N) and in order to remove ambiguity between other fragments contributing to lower-mass channels. It is important to note that the main indene mass peak at m/z=116 was not taken due to its lower S/N compared to the m/z=115 channel, which is also a major peak in the indene fragmentation pattern. As for water, the analyzed mass channels were m/z=18 and 17. Fig. 2 displays first the averaged integrated optical depth of the two indene IR bands over that of water as they evolve as a function of ion fluence. The indene bands uncertainties come from the differences of the two bands’ values and those of water from two methods of baseline correction: a spline and a line. The QMS indene-to-water ratio is also displayed. The latter was obtained by averaging the indene QMS mass channels at each fluence value, and dividing them by the corresponding average of those of water. In addition, the curve was scaled to the IR curve by a factor of 2, and whose implication is detailed later. The initial point of the QMS signal (designated by a star), corresponding to the initial deposited amount of indene-to-water, lies lower than the IR value. Note that the first ions impinging on the ice induce a phase change in the water ice matrix. The increase in the sputtering seen at the beginning of the QMS curve, is related to the phase change in the water matrix, transitioning from an amorphous solid water phase (lower sputtering rate) to a compact amorphous solid water phase (higher sputtering rate). Such a phase change is evidenced via the evolution of the stretching OH mode profile of water in the IR. After the first fluence steps, most of the ice evolved to this amorphous compact phase, and the sputtering evolves synchronously to the ice bulk composition. In the ISM, ices are expected to be present in compact amorphous form (Jenniskens & Blake 1994) because of its formation on surfaces being exoenergetic (Accolla et al. 2013). In addition, UV (Palumbo et al. 2010) and CR (Mejía et al. 2015) interactions also play a role in this compaction. Thus, after the two first points, the sputtering of compact amorphous ice in our experiments is more representative of the scenario in the ISM. The uncertainties in the values of both species come from the differences in the chosen mass channels. Shaded areas represent 2σ of the calculated error margins. Apart from the scaling factor discussed hereafter, both IR and QMS signals behave in a similar manner. The lower indene-to-water ratio measured in the gas phase compared to that in the ice bulk shows that indene sputtering depends on both its sputtering yield and its radiolysis efficiency. Indeed, the gas phase ratio evolution detected by the QMS is proportional to the IR signal probing the solid phase concentration ratios of indene-to-water, which shows a decrease mainly due to the radiolysis of the species.
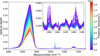 |
Fig. 1 Optical depth spectra for the 1:100 indene in water matrix experiment as a function of ion fluence. The water feature at around 3300 cm−1 is displayed as well as a close-up view of the two analyzed indene features at 1458 cm−1 and 1393 cm−1. The color bar represents the irradiation fluence at which each spectrum was taken. |
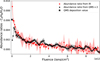 |
Fig. 2 Abundance ratios of indene to water deduced from IR (red curve) and QMS (black curve) signals in the 1:100 indene-to-water experiment. Shaded areas around each curve represent 2σ uncertainties on measurements. The QMS curve was multiplied by a scaling factor of 2 to match the IR one (see text for details). |
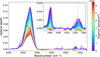 |
Fig. 3 Optical depth spectra for the 12:100 indene-to-water experiment. The water feature at around 3300 cm−1 is displayed as well as a close-up view of the two analyzed indene features at 1458 cm−1 and 1393 cm−1. The color bar shows the evolution of spectra with respect to irradiation fluence. |
3.1.2 Indene:Water (12:100)
A subsequent mixture with a higher indene-to-water ratio of 12:100 was irradiated as well. In a similar manner, using the same features for IR analysis as in the previous experiment, the evolution of the species’ spectra in the solid phase is shown in Fig. 3. As for the gas phase analysis, the masses chosen for indene are: m/z=116, 89, and 63. In this case, we were able to analyze the main indene mass peak at m/z=116, contrary to the previous experiment in which the signal was too noisy. As for the m/z=63 channel, also not taken in the previous experiment for the same reason just mentioned, it corresponds to C5H3, probably a pentagon cycle. Fig. 4 displays the evolution of the indene-to-water ratio present in the ice bulk probed by IR and that present in the gas phase by QMS, which in this case is scaled by a factor of 3.5 to match the IR curve. The uncertainties were calculated in the same manner as in the previous experiment, and are displayed as a 2σ error margin by shaded areas around their corresponding curve. The gas-phase deposition value (first star point of the QMS curve) remains lower than the IR one, but within error margins. During irradiation, both signals evolve similarly, in accordance with the fact that the gas phase reflects the solid-phase composition.
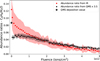 |
Fig. 4 Abundance ratios of indene to water deduced from IR (red curve) and QMS (black curve) signals in the 12:100 indene-to-water experiment. Shaded areas around each curve represent 2σ uncertainties on measurements. The ratios obtained from the QMS are scaled to the IR ones by a factor of 3.5. |
3.2 Adamantane
During this set of experiments, we also explored another high molecular weight molecule, adamantane, a cage molecule whose relevance is mainly due to the diamondoid detection in the ISM (Guillois et al. 1999). Adamantane and water were mixed and deposited on the substrate with only one concentration ratio, compared to the previous case, of 4:100 of adamantane-to-water molecules. In a similar manner, column densities’ evolution was determined from the continuous IR probing during irradiation by using the OH stretch for water, and the CH2 stretching and CH2 scissoring modes for adamantane at 2855 cm−1 and 1454 cm−1, respectively (Bistričić et al. 1995). The adamantane features’ band strengths correspond to A2855 = 1.3 × 10⁻¹⁷ and A1454 = 3.0 × 10⁻¹⁸ cm mol−1 (band strength calculations are detailed in Appendix A). The specific features are shown in Fig. 5. As for the gas-phase analysis, the QMS channels chosen for adamantane are m/z = 136 and 79, corresponding to the main adamantane mass peak and the C6H7+ fragment, respectively. Fig. 6 displays the evolution of the adamantane-to-water ratio calculated from both the IR and QMS signals, with the latter multiplied by a scaling factor of 5. The shaded areas, obtained using the same method as in the previous experiments, denote the 2σ uncertainty range on the measurments. The deposition signal deduced from the QMS signal designated by a star lies, within uncertainties, just above the one calculated from the IR, suggesting a coherence between these two measurements. As for the rest of the evolution, the two signals evolve in parallel. The QMS signal always being lower than the bulk signal probed by IR is a sign that the adamantane sputtering yield is influenced both by its sputtering and by radiolysis efficiencies.
Going back to the individual IR evolution as a function of ion fluence of indene and adamantane, it is possible to infer their ion-induced destruction. By fitting the evolution of the species’ normalized column density, N, as a function of the fluence, F, with the exponential decay equation N=e−σRF, one can retrieve the radiolysis cross section, σR, for each of them. The results are summarized in Table 1. The presented values correspond to the average of the radiolysis cross sections obtained from the two features taken for each species. The evolution of the column density as a function of the ion fluence for each species is shown in Fig. B.1 alongside the corresponding fits.
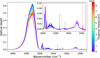 |
Fig. 5 Optical depth spectra for the adamantane in a water matrix experiment. A zoomed-in view of the two analyzed adamantane features at 2855 cm−1 and 1454 cm−1. The color bar shows the evolution of spectra with respect to irradiation fluence. |
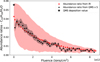 |
Fig. 6 Abundance ratios of adamantane to water deduced from IR (red curve) and QMS (black curve) signals. Uncertainties of 2σ are represented as shaded areas around each curve. The ratio obtained from the QMS is roughly five times lower than the IR one, and hence the multiplicative factor. |
Effective radiolysis cross section for the different analog ice mixtures using 40 MeV 56Fe10+ ions.
4 Astrophysical implications
Sputtering of ice mixtures leads not only to the desorption of the parent molecules, but to their progressive destruction as well. The QMS signal allows us to follow with selected masses the intact fraction of indene sputtered with respect to water, i.e., unmodified indene molecules. Thus, by scaling it to the IR evolution, we obtain the ejected intact-to-solid ratio of sputtered indene molecules. In the first case of the low-concentration indene experiment, half of the indene present in the solid phase water matrix is sputtered as intact molecules, which represents a higher fraction than in the higher concentration experiment in which the yield is only a third. Given the fact that the considered quantities are number ratios of indene to water molecules, water represents more of a matrix in the first case than in the second. Thus, the difference between the two can be attributed to the desorption of intact indene molecules as a result of water matrix entrained desorption (since water has a higher vapor pressure and because most of the energy deposited will be delivered to the water molecules), which is more efficient in the case in which water is more abundant. However, as is seen in Table 1, increasing the water ratio in the mixture also increases the effective radiolysis cross section. This can be explained by the dissociated water molecules reacting with indene molecules leading to their destruction rather than the pure radiolysis of indene molecules. As was explained in Cooper et al. (2008), OH radicals can diffuse along ion tracks, though for short distances only, and react at 10 K. Thus, we measured the net sputtering effect from both processes, which still resulted in a more sputtered indene fraction in the low-concentration mix (1:100). In molecular clouds, we can expect ratios closer to the first experiment as PAHs in general are expected to be low in abundance in ice mantles. As for adamantane, about a fifth of the sputtered species is in its intact form.
In all three previous cases, the intact sputtered species fraction is less than half the total yield. This implies that not only is the gas phase medium getting enriched with the parent molecule in question, but also with its radiolysis offsprings. [Details on the implications of this effect are presented later.]
As was mentioned, observations toward the cold dense cloud TMC-1 by the GOTHAM (Cernicharo et al. 2021) and QUIJOTE (Burkhardt et al. 2021) surveys revealed the presence of indene with similar abundances of 0.96-1.6 × 10⁻⁹ with respect to H2 (hence 0.5-0.8 × 10⁻⁹ with respect to H). However, the formation routes of this molecule are still ambiguous as it is still not completely understood how cyclization occurs in cold clouds, which highlights the need for more complex astrochemical models.
Reinjection rates. To evaluate the impact of indene-seeded water ice mantles’ relative sputtering rate, we can anchor our result to the water ice sputtering rate using previous calculations as a function of the ionization rate shown in Fig. 7. This allows for the calculation of the gas-phase replenishment by sputtering of species condensed on grains:
![Mathematical equation: R_\mathrm{r}\textrm{[cm\(^{-3}\)s\(^{-1}\)]}=Y^{\mathrm{eff}}_\mathrm{e} \times\Sigma_{\mathrm{grains}}\times n(H)\times f_{\mathrm{ice}}^\mathrm{X} \times f_{\mathrm{intact}}^\mathrm{X}](/articles/aa/full_html/2025/11/aa56030-25/aa56030-25-eq1.png) (1)
(1)
where  is the effective sputtering rate, here taken as that of water ice since it is the dominant ice species and acts as a PAH-embedded matrix, Σgrains the effective grain surface per hydrogen atom, n(H) the hydrogen number density in the considered region,
  the species X fraction in the ice with respect to water, and
  the fraction of intact sputtered molecules corresponding to the scaling factor between the indene-to-water ratios in the solid phase obtained from the IR, and in the gas phase measured with the QMS. The effective grain size, given by
![Mathematical equation: \Sigma_{\mathrm{grains}}\textrm{[cm\(^{2}\)H\(^{-1}\)]}=\frac{1}{n(H)}\int \mathrm{\pi} a^2 n(a) \mathrm{d}a](/articles/aa/full_html/2025/11/aa56030-25/aa56030-25-eq5.png) (2)
(2)
with n(a) being the distribution of grains with respect to their size a, is quite sensitive to the chosen parameters. For instance, an order-of-magnitude difference arises when taking a silicon core density of 3 g cm−3, resulting in a surface density of 1.2 × 10⁻²¹ cm2/H (Mathis et al. 1977), and a carbon core density of 1.6 g cm−3, giving a surface density of 1.7 × 10⁻²⁰ cm2 per hydrogen atom (Jones et al. 2017). Thus, the values calculated hereafter take into account the range 1.2-17 × 10−21 cm2/H.
Accretion (or freeze-out) of PAH onto the grains counteracts the gas-phase replenishment process, favoring their solid-phase abundance. Its rate is given by
![Mathematical equation: R_\mathrm{a}\textrm{[cm\(^{-3}\)s\(^{-1}\)]}=f_{gas}^X\times n(H)^2 \times \Sigma_{\mathrm{grains}} \times \bar{v}](/articles/aa/full_html/2025/11/aa56030-25/aa56030-25-eq6.png) (3)
(3)
where  is the mean gas velocity and
  is the fraction of the considered species released in the gas phase. By only considering these two effects, which is more valid in the deep shielded parts of the cloud where the radiation field, and thus photolytic effects, are less important, the ratio between the gas-phase and solid-phase indene can be determined from the two equations (1,3). Considering a medium visual extinction of AV = 5 corresponding to an ionization rate of ζ = 4 × 10⁻¹⁷s−1 and a sputtering rate of
  , we obtain a steady-state value of
  . Thus, by taking the values of indene observed in the gas-phase in TMC-1, the minimum abundance in the ice would be fice = 1.2-2.0 × 10⁻⁴. As was shown previously in Section 3, the intact ejected indene fraction increases from 30% to 50% when the indene to water ratio is decreased from 12:100 to 1:100. We adopted the low-indene experiment scaling factor fintact, i.e., 50% intact molecules sputtered as it represents a closer abundance of indene in interstellar ices. Still we cannot exclude that for an indene-to-water ratio lower than 1:100 we might even expect a slightly higher intact fraction to be ejected.
Finally, an additional term that also diminishes the species’ abundance in the gas phase is their photolytic destruction, given by
![Mathematical equation: R_\mathrm{d}\textrm{[cm\(^{-3}\)s\(^{-1}\)]}=R_\mathrm{d}^{\mathrm{VUV}} + R_\mathrm{d}^{\mathrm{secondary VUV}}](/articles/aa/full_html/2025/11/aa56030-25/aa56030-25-eq11.png) (4)
(4)
Details about each term and the assumptions made are explained in Dartois et al. (2022), and thus only the main notions are recalled below.
The first term,  , is the photolytic destruction rate that dominates in the outer and diffuse parts of clouds and decreases with optical depth. It is expressed as
![Mathematical equation: R_\mathrm{d}^{\mathrm{VUV}}\textrm{[cm\(^{-3}\)s\(^{-1}\)]}=R(0)\times \mathrm{\chi} \times \mathrm{e}^{-\tau_d} \times f_{\mathrm{gas}}^\mathrm{X} \times n(\mathrm{H})](/articles/aa/full_html/2025/11/aa56030-25/aa56030-25-eq13.png) (5)
(5)
where R(0) is the photodissociation rate per molecule for the interstellar standard radiation field (ISRF) (χ = 1) attenuated by dust absorption (e−τd). The latter can be approximated with visual extinction dependency as e−2Av.
The second term,  , takes into account the VUV field induced by CRs deep inside clouds. By adopting the ISRF from Mathis et al. (1983), we calculated the intensity of this secondary UV field to be FUV
  , which gives
![Mathematical equation: R_\mathrm{d}^{\mathrm{secondary VUV}}\textrm{[cm\(^{-3}\)s\(^{-1}\)]}\approx R(0) \times \frac{6.5 \times 10^{-6}\zeta^{ext}}{10^{-17}s^{-1}}\times f_{\mathrm{gas}}^\mathrm{X}\times n(\mathrm{H})](/articles/aa/full_html/2025/11/aa56030-25/aa56030-25-eq16.png) (6)
(6)
At steady-state, Rr = Ra + Rd. Thus,
 (7)
(7)
Indene’s photodissociation rate can be interpolated from Allain et al. (1996) to be R(0) ≈ 3 × 10⁻¹⁰s−1. Taking the same parameters as before for AV = 5 (i.e., ζ = 4 × 10⁻¹⁷s−1 and Y ≈ 4cm−2s−1), we obtain
  and
and  for grain sizes of Σgrains = 1.2 × 10⁻²¹ cm2/H and Σgrains = 1.7 × 10⁻²⁰ cm2/H, respectively.
Finally, the indene fraction expected to be present in interstellar ices can be calculated over the cloud depth. By considering a plummer-like profile for both the hydrogen density, n(H), and the visual extinction, AV, as in Fig. 1 in Wakelam et al. (2021), the higher limit of detected indene in the gas phase of 1.6 × 10⁻⁹n(H), and a Σgrain = 1.2 × 10⁻²¹cm2/H, the evolution of the indene ice abundance with respect to water is shown in Fig. 8.
Two limits are shown in this graph. The first one, Av,ice = 1.5 falling at around 28 000 AU, sets the minimum visual extinction (threshold) where ice is expected to form on dust grains (Fig. 2 in Murakawa et al. (2000), Fig. 7 in Boogert et al. (2015); note that AV thresholds in both cases are to be divided by two as they include both sides of the cloud: entry and exit). The second one, Av,shield = 5.4 at 11 100 AU, describes the point at which the external UV field and the secondary one produced by CRs have the same contribution. Above this value of AV, the external field is almost negligible compared to the latter. It is important to keep in mind that this model is a first-order calculation made to get a first estimate of the abundance of indene in the ice. As more processes come into play further from the center, the required models become more complex to simulate cloud conditions. Thus, ours holds its validity mostly in the inner densest parts of molecular clouds, giving rise to an expected indene fraction of around 3-5 × 10⁻³ with respect to water to sustain its abundance if driven by ice mantle sputtering. We aim to include UV photolysis of the ice, as well as its radiolysis, in a more timedependent self-consistent model later, in order to increase the accuracy of the cloud’s model.
As was mentioned previously, it is important keep in mind the contribution of the radiolysis of large molecules in producing and ejecting daughter complex organic molecules and radicals, an effect that would ideally be included in the model as well. Here, we explore the possibility of gas-phase cyclic species formation following indene irradiation. To do so, we compare the QMS signal during deposition to that during irradiation of the 12:100 indene to water experiment, by normalizing both to the mass channel where the scaling factor between the irradiation and deposition values is the highest. In this way, it is easier to visualize the increase in the species’ signal during irradiation. We chose to do this comparison for the 12:100 experiment and not the 1:100 one as the signal in the latter is too faint to quantify lower-mass peaks (the distribution of secondary species produced by the radiolytic processes should slightly differ in the lower mix because of the higher fraction of water, but many of them are still ejected). Fig. 9 shows the difference between the two signals over the range m/z=72-78. This mass range was chosen as it corresponds to where benzene has the most signal. The range m/z=48-52 is also shown as this is where the molecule’s secondary peaks appear. Fig. 10 displays the range m/z=84-91, which could be attributed to C7H5 with an ambiguity as C6HO has the same mass and could be a result of the reaction between an indene fragment and an oxygen coming from dissociated water molecules. In both of these cases, the QMS signal during irradiation mostly gives relative values higher than during deposition, which leads us to think that indene sputtering by CRs could contribute to the replenishment of gas-phase aromatic molecules.
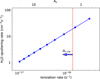 |
Fig. 7 Sputtering rate of water ice as a function of the ionization rate taken from Dartois et al. (2023). The equivalency between the visual extinction, Av, and the ionization rate is displayed in the upper abscissa (Neufeld & Wolfire 2017). The arrow represents the lower limit above which ice is expected to be present (Av,ice ≈ 1.5). |
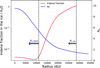 |
Fig. 8 Visual extinction, Av (blue), and the calculated indene fraction in the ice with respect to H2O (red), as a function of the position in the cloud. The dashed line on the right represents the visual extinction limit above which we expect the presence of ice (Av,ice ≈ 1.5), and that on the left denotes the limit above which the radiation field is dominated by the secondary UV one (Av,shield ≈ 5.4). |
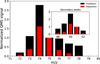 |
Fig. 9 Normalized QMS signal to m/z=75 and m/z=51 (refer to text for details) in the ranges m/z=72-79 and m/z=48-52 corresponding to the primary and secondary possible cyclic species’ mass peaks, both during deposition and irradiation of the 12:100 indene to water experiment. |
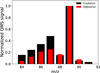 |
Fig. 10 Normalized QMS signal to m/z=89 in the range m/z=84-91 during deposition and irradiation of the 12:100 indene to water experiment. |
5 Conclusion
In this study, we subjected ice films of indene and adamantane mixed in a water matrix to a high-energy heavy ion beam. We were able to deduce the effective radiolysis cross sections of the species as well as their intact-to-solid ratio during sputtering, and extrapolate the results into astrochemical models.
For indene, by using different mixing ratios with respect to water, we obtain different effective radiolysis cross sections and ratios of sputtered intact-to-solid species. Indeed, we observe both a higher radiolysis cross section and a higher fraction of sputtered intact indene molecules in the 1:100 indene-to-water mixture compared to the 12:100 one. This could be attributed to the water matrix entrained desorption of indene molecules during the thermal spike induced event, as well as water’s chemical activity ignited by ion irradiation leading to the formation of radicals that destroy indene molecules. The mixing ratio of 1:100 is expected to represent a closer match to an interstellar ice composition dominated by a water ice mantle matrix.
Previous gas phase observations of indene toward the TMC-1 cloud revealed surprisingly high abundances (≈1-1.6 × 10⁻⁹ n(H2)) that are difficult to explain with current astrochemical models inside dense clouds in which accretion timescales are much shorter than those of the environment. Thus, CR interaction with interstellar grains must play a major role in sustaining the high gas-phase fraction of such big molecules when present in ice mantles on dust grains.
In the first-order model we adopted and in the context of high-energy CRs such as those dominating in dense clouds exposed to galactic fluxes, the previous radiolytic events acting throughout the cloud lifetime and leading to the actual ice bulk composition are not explicitly included. Rather, we prescribe the result of sputtering for a given fractional abundance of indene and adamantane from our experiments. Such radiolysis is not to be neglected when constructing a self-consistent model to paint an accurate picture of the time-dependent chemistry. In the future, constructing a time-dependent model of the molecular cloud evolution (UV, CR, surface reactions, etc.) will provide a more comprehensive description, leading to a refined abundance estimate of such PAHs in the ice phase. Nonetheless, by only including three main phenomena at play within our model, the sputtering of ice mantles, accretion of species from the gas-phase, and the gas-phase UV photolysis, the abundance of indene required in the ice phase as a function of the molecular cloud depth is expected to be around a few thousandths with respect to water.
Acknowledgements
The experiment was performed at Grand Accélérateur National d’Ions Lourds (GANIL) by means of CIRIL Interdisciplinary Platform, part of CIMAP laboratory, Caen, France. We thank the staff of CIMAP-CIRIL and GANIL for their invaluable support. We acknowledge funding from the French National Research Agency, ANR IGLIAS (grant ANR-13-BS05-0004). This work was supported by the Thematic Action “Physique et Chimie du Milieu Interstellaire” (PCMI) of INSU Programme National “Astro”, with contributions from CNRS Physique & CNRS Chimie, CEA and CNES. We thank the referee J. A. Nuth for his constructive comments on the manuscript and his help in improving its content.
References
- Accolla, M., Congiu, E., Manicò, G., et al. 2013, MNRAS, 429, 3200 [NASA ADS] [CrossRef] [Google Scholar]
- Allain, T., Leach, S., & Sedlmayr, E. 1996, A&A, 305, 602 [NASA ADS] [Google Scholar]
- Anders, E., & Zinner, E. 1993, Meteoritics, 28, 490 [Google Scholar]
- Augé, B., Been, T., Boduch, P., et al. 2018, Rev. Sci. Instrum., 89, 075105 [Google Scholar]
- Belloche, A., Maury, A. J., Maret, S., et al. 2020, A&A, 635, A198 [NASA ADS] [CrossRef] [EDP Sciences] [Google Scholar]
- Bistričić, L., Baranović, G., & Mlinarić-Majerski, K. 1995, Spectrochim. Acta Part A Mol. Spectrosc., 51, 1643 [Google Scholar]
- Boogert, A. C. A., Gerakines, P. A., & Whittet, D. C. B. 2015, ARA&A, 53, 541 [Google Scholar]
- Burkhardt, A. M., Long Kelvin Lee, K., Bryan Changala, P., et al. 2021, ApJ, 913, L18 [NASA ADS] [CrossRef] [Google Scholar]
- Cernicharo, J., Agúndez, M., Cabezas, C., et al. 2021, A&A, 649, L15 [EDP Sciences] [Google Scholar]
- Chabot, M. 2016, A&A, 585, A15 [NASA ADS] [CrossRef] [EDP Sciences] [Google Scholar]
- Chevance, M., Kruijssen, J. M. D., Vazquez-Semadeni, E., et al. 2020, Space Sci. Rev., 216, 50 [NASA ADS] [CrossRef] [Google Scholar]
- Cooper, P. D., Moore, M. H., & Hudson, R. L. 2008, Icarus, 194, 379 [Google Scholar]
- Dartois, E., Chabot, M., Id Barkach, T., et al. 2019, A&A, 628, C2 [NASA ADS] [CrossRef] [EDP Sciences] [Google Scholar]
- Dartois, E., Chabot, M., Koch, F., et al. 2022, A&A, 663, A25 [NASA ADS] [CrossRef] [EDP Sciences] [Google Scholar]
- Dartois, E., Chabot, M., da Costa, C. A. P., et al. 2023, A&A, 671, A156 [NASA ADS] [CrossRef] [EDP Sciences] [Google Scholar]
- Doddipatla, S., Galimova, G. R., Wei, H., et al. 2021, Sci. Adv., 7, eabd4044 [Google Scholar]
- Guillois, O., Ledoux, G., & Reynaud, C. 1999, ApJ, 521, L133 [NASA ADS] [CrossRef] [Google Scholar]
- Habart, E., Natta, A., Testi, L., & Carbillet, M. 2006, A&A, 449, 1067 [NASA ADS] [CrossRef] [EDP Sciences] [Google Scholar]
- Haynes, W. M. 2016, CRC Handbook of Chemistry and Physics (CRC Press) [Google Scholar]
- Jenniskens, P., & Blake, D. F. 1994, Science, 265, 753 [NASA ADS] [CrossRef] [Google Scholar]
- Jones, A. P., Köhler, M., Ysard, N., Bocchio, M., & Verstraete, L. 2017, A&A, 602, A46 [NASA ADS] [CrossRef] [EDP Sciences] [Google Scholar]
- Lefloch, B., Bachiller, R., Ceccarelli, C., et al. 2018, MNRAS, 477, 4792 [Google Scholar]
- Maté, B., Tanarro, I., Timón, V., Cernicharo, J., & Herrero, V. J. 2023, MNRAS, 523, 5887 [CrossRef] [Google Scholar]
- Mathis, J. S., Mezger, P. G., & Panagia, N. 1983, A&A, 128, 212 [NASA ADS] [Google Scholar]
- Mathis, J. S., Rumpl, W., & Nordsieck, K. H. 1977, ApJ, 217, 425 [Google Scholar]
- Mejía, C., de Barros, A. L. F., Seperuelo Duarte, E., et al. 2015, Icarus, 250, 222 [CrossRef] [Google Scholar]
- Meyer, J.-P., Drury, L. O., & Ellison, D. C. 1998, Space Sci. Rev., 86, 179 [Google Scholar]
- Murakawa, K., Tamura, M., & Nagata, T. 2000, ApJS, 128, 603 [Google Scholar]
- Neufeld, D. A., & Wolfire, M. G. 2017, ApJ, 845, 163 [Google Scholar]
- Palumbo, M. E., Baratta, G. A., Leto, G., & Strazzulla, G. 2010, J. Mol. Struct., 972, 64 [NASA ADS] [CrossRef] [Google Scholar]
- Shen, C. J., Greenberg, J. M., Schutte, W. A., & van Dishoeck, E. F. 2004, A&A, 415, 203 [NASA ADS] [CrossRef] [EDP Sciences] [Google Scholar]
- Wakelam, V., Dartois, E., Chabot, M., et al. 2021, A&A, 652, A63 [NASA ADS] [CrossRef] [EDP Sciences] [Google Scholar]
- Ziegler, J. F., Ziegler, M. D., & Biersack, J. P. 2010, Nucl. Instrum. Methods Phys. Res. B, 268, 1818 [Google Scholar]
Appendix A Adamantane band strength
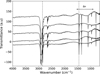 |
Fig. A.1 IR transmittance spectra taken of adamantane thin films of various thicknesses. This difference in thickness between samples leads to the appearance of interference fringes of different lengths. The dashed lines indicate the two IR bands at 2855 and 1454 cm−1 of which we are interested to determine the band strengths. Δν represents an example of the fringe length of the upper spectra which is used in the calculations to determine the local film thickness. The spectra are vertically shifted for clarity. |
The band strength of a certain IR band at a wavenumber ν is defined as:
 (A.1)
(A.1)
where τ is the optical depth of this band and N its associated column density. In order to calculate the band strengths of the two IR bands of adamantane used in the analysis at 2855 and 1454 cm−1, IR spectra of an adamantane thin film were taken (Fig. A.1). Each spectra was taken at a different position on the film, and hence the difference in the baseline shape. Thin films induce fringes in the IR spectra that reflect the films’ thicknesses following the equation:
 (A.2)
(A.2)
where ε is the film’s thickness, n its refractive index, and Δν is the fringe’s length in cm−1 obtained from the IR spectrum. Calculating the thickness then allows the determination of the column density:
 (A.3)
(A.3)
where ρ is the film’s density, NA Avogadro’s number, and M is adamantane’s molar mass. The values taken for adamantane are M=136.15 g mol−1, ρ=1.07 g cm−3, and n=1.568 (Haynes 2016).
Thus, by calculating the band strength for each feature for the different spectra and averaging them, we obtain A2855 = (1.3 ± 0.1) × 10−17 cm mol−1 and A1454 = (3.0 ± 0.3) × 10−18 cm mol−1.
Appendix B Radiolysis cross section
In order to determine radiolysis cross sections of the different species used in this experiment i.e., indene and adamantane in a water matrix, their corresponding integrated optical depth is determined with respect to the ion fluence F and shown in Fig. B.1. Each normalized integrated cross section N is fitted by the equation N=e−σRF allowing the determination of the radiolysis cross section σR. For each mixture, the latter is averaged and summarized in Table 1.
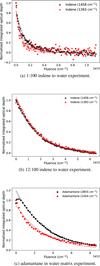 |
Fig. B.1 Integated optical depth of the features of the different species used in our experiments. Dashed lies represents exponential decay fits used to determine radiolysis cross section of the species. |
All Tables
Effective radiolysis cross section for the different analog ice mixtures using 40 MeV 56Fe10+ ions.
All Figures
|
Fig. 1 Optical depth spectra for the 1:100 indene in water matrix experiment as a function of ion fluence. The water feature at around 3300 cm−1 is displayed as well as a close-up view of the two analyzed indene features at 1458 cm−1 and 1393 cm−1. The color bar represents the irradiation fluence at which each spectrum was taken. |
| In the text | |
|
Fig. 2 Abundance ratios of indene to water deduced from IR (red curve) and QMS (black curve) signals in the 1:100 indene-to-water experiment. Shaded areas around each curve represent 2σ uncertainties on measurements. The QMS curve was multiplied by a scaling factor of 2 to match the IR one (see text for details). |
| In the text | |
|
Fig. 3 Optical depth spectra for the 12:100 indene-to-water experiment. The water feature at around 3300 cm−1 is displayed as well as a close-up view of the two analyzed indene features at 1458 cm−1 and 1393 cm−1. The color bar shows the evolution of spectra with respect to irradiation fluence. |
| In the text | |
|
Fig. 4 Abundance ratios of indene to water deduced from IR (red curve) and QMS (black curve) signals in the 12:100 indene-to-water experiment. Shaded areas around each curve represent 2σ uncertainties on measurements. The ratios obtained from the QMS are scaled to the IR ones by a factor of 3.5. |
| In the text | |
|
Fig. 5 Optical depth spectra for the adamantane in a water matrix experiment. A zoomed-in view of the two analyzed adamantane features at 2855 cm−1 and 1454 cm−1. The color bar shows the evolution of spectra with respect to irradiation fluence. |
| In the text | |
|
Fig. 6 Abundance ratios of adamantane to water deduced from IR (red curve) and QMS (black curve) signals. Uncertainties of 2σ are represented as shaded areas around each curve. The ratio obtained from the QMS is roughly five times lower than the IR one, and hence the multiplicative factor. |
| In the text | |
|
Fig. 7 Sputtering rate of water ice as a function of the ionization rate taken from Dartois et al. (2023). The equivalency between the visual extinction, Av, and the ionization rate is displayed in the upper abscissa (Neufeld & Wolfire 2017). The arrow represents the lower limit above which ice is expected to be present (Av,ice ≈ 1.5). |
| In the text | |
|
Fig. 8 Visual extinction, Av (blue), and the calculated indene fraction in the ice with respect to H2O (red), as a function of the position in the cloud. The dashed line on the right represents the visual extinction limit above which we expect the presence of ice (Av,ice ≈ 1.5), and that on the left denotes the limit above which the radiation field is dominated by the secondary UV one (Av,shield ≈ 5.4). |
| In the text | |
|
Fig. 9 Normalized QMS signal to m/z=75 and m/z=51 (refer to text for details) in the ranges m/z=72-79 and m/z=48-52 corresponding to the primary and secondary possible cyclic species’ mass peaks, both during deposition and irradiation of the 12:100 indene to water experiment. |
| In the text | |
|
Fig. 10 Normalized QMS signal to m/z=89 in the range m/z=84-91 during deposition and irradiation of the 12:100 indene to water experiment. |
| In the text | |
|
Fig. A.1 IR transmittance spectra taken of adamantane thin films of various thicknesses. This difference in thickness between samples leads to the appearance of interference fringes of different lengths. The dashed lines indicate the two IR bands at 2855 and 1454 cm−1 of which we are interested to determine the band strengths. Δν represents an example of the fringe length of the upper spectra which is used in the calculations to determine the local film thickness. The spectra are vertically shifted for clarity. |
| In the text | |
|
Fig. B.1 Integated optical depth of the features of the different species used in our experiments. Dashed lies represents exponential decay fits used to determine radiolysis cross section of the species. |
| In the text | |
Current usage metrics show cumulative count of Article Views (full-text article views including HTML views, PDF and ePub downloads, according to the available data) and Abstracts Views on Vision4Press platform.
Data correspond to usage on the plateform after 2015. The current usage metrics is available 48-96 hours after online publication and is updated daily on week days.
Initial download of the metrics may take a while.