Open Access
Fig. 6
Download original image
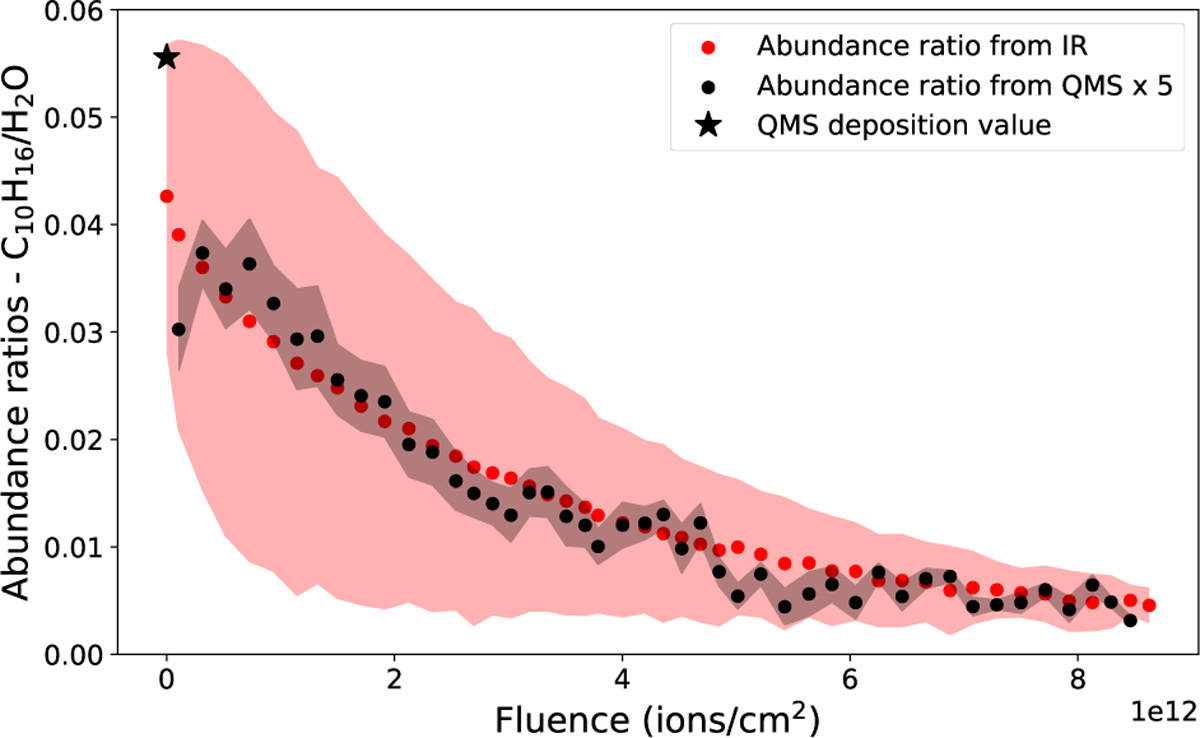
Abundance ratios of adamantane to water deduced from IR (red curve) and QMS (black curve) signals. Uncertainties of 2σ are represented as shaded areas around each curve. The ratio obtained from the QMS is roughly five times lower than the IR one, and hence the multiplicative factor.
Current usage metrics show cumulative count of Article Views (full-text article views including HTML views, PDF and ePub downloads, according to the available data) and Abstracts Views on Vision4Press platform.
Data correspond to usage on the plateform after 2015. The current usage metrics is available 48-96 hours after online publication and is updated daily on week days.
Initial download of the metrics may take a while.