Open Access
Fig. 9
Download original image
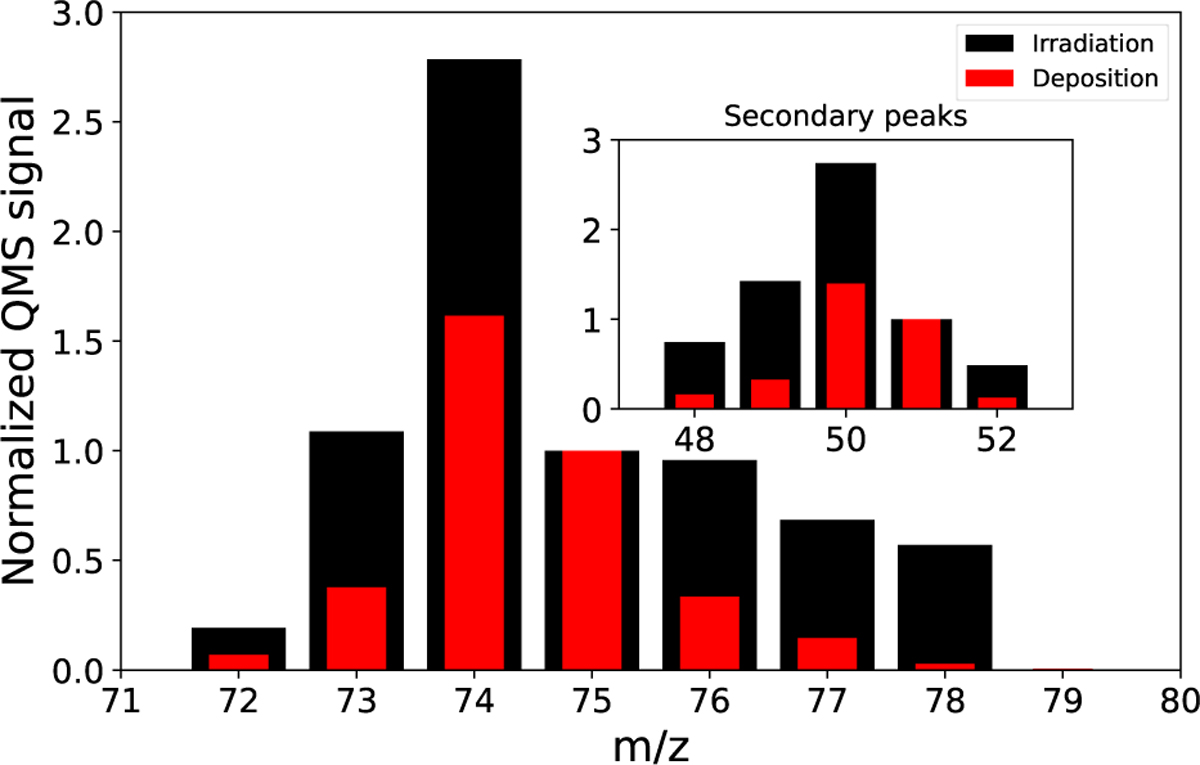
Normalized QMS signal to m/z=75 and m/z=51 (refer to text for details) in the ranges m/z=72-79 and m/z=48-52 corresponding to the primary and secondary possible cyclic species’ mass peaks, both during deposition and irradiation of the 12:100 indene to water experiment.
Current usage metrics show cumulative count of Article Views (full-text article views including HTML views, PDF and ePub downloads, according to the available data) and Abstracts Views on Vision4Press platform.
Data correspond to usage on the plateform after 2015. The current usage metrics is available 48-96 hours after online publication and is updated daily on week days.
Initial download of the metrics may take a while.