Fig. 1.
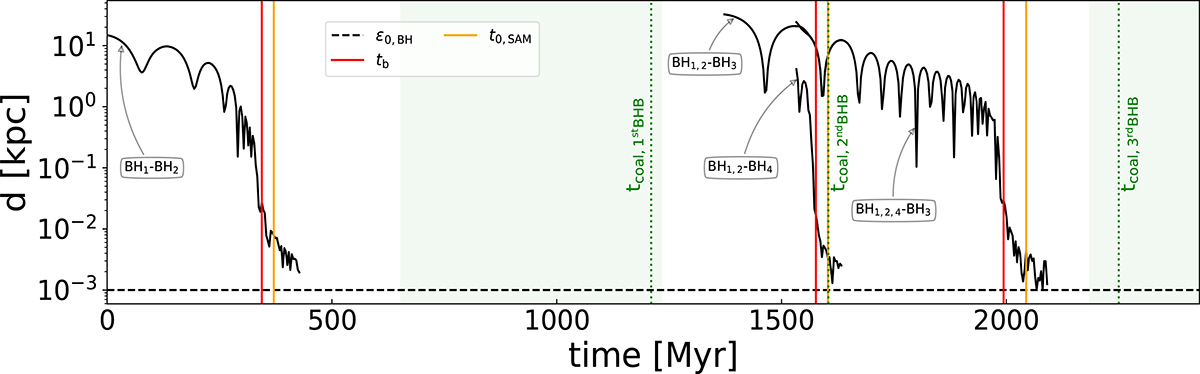
Download original image
Merger tree 197109 - HR. We show the time evolution of the BHs separation in Griffin simulations. The horizontal dashed black line indicates the softening length ε0,BH = 1 pc. Vertical red lines represent binary formation times; vertical yellow lines represent initial times chosen for the SAM; vertical green lines are the predicted coalescence times, with the corresponding uncertainties drawn as shaded green areas. Note that for the second BHB the predicted time of coalescence almost overlaps with t0,SAM. This is because the eccentricity at binary formation is so extreme that the system merges immediately due to GW emission. As a consequence, this particular system does not form a triplet.
Current usage metrics show cumulative count of Article Views (full-text article views including HTML views, PDF and ePub downloads, according to the available data) and Abstracts Views on Vision4Press platform.
Data correspond to usage on the plateform after 2015. The current usage metrics is available 48-96 hours after online publication and is updated daily on week days.
Initial download of the metrics may take a while.