Open Access
Fig. A.2.
Download original image
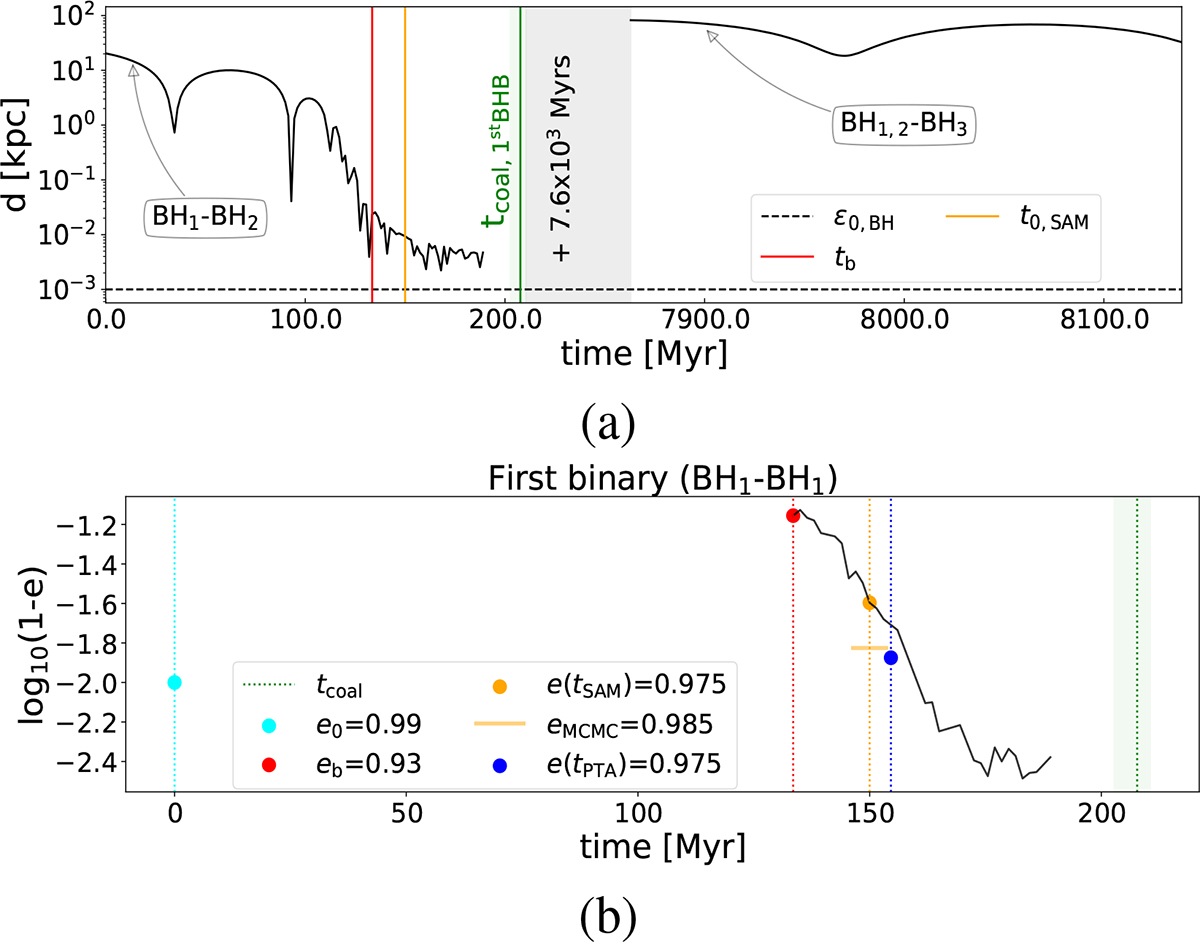
(a) Merger tree 17187-HR: time evolution of the BHs separation. The plotted grey area denotes a jump in time of 7.6 × 10³ Myr, used to make the plot clearer. (b) Evolution of the orbital eccentricity of the first BHB (BH1 and BH2) formed in Tree 17187-HR.
Current usage metrics show cumulative count of Article Views (full-text article views including HTML views, PDF and ePub downloads, according to the available data) and Abstracts Views on Vision4Press platform.
Data correspond to usage on the plateform after 2015. The current usage metrics is available 48-96 hours after online publication and is updated daily on week days.
Initial download of the metrics may take a while.