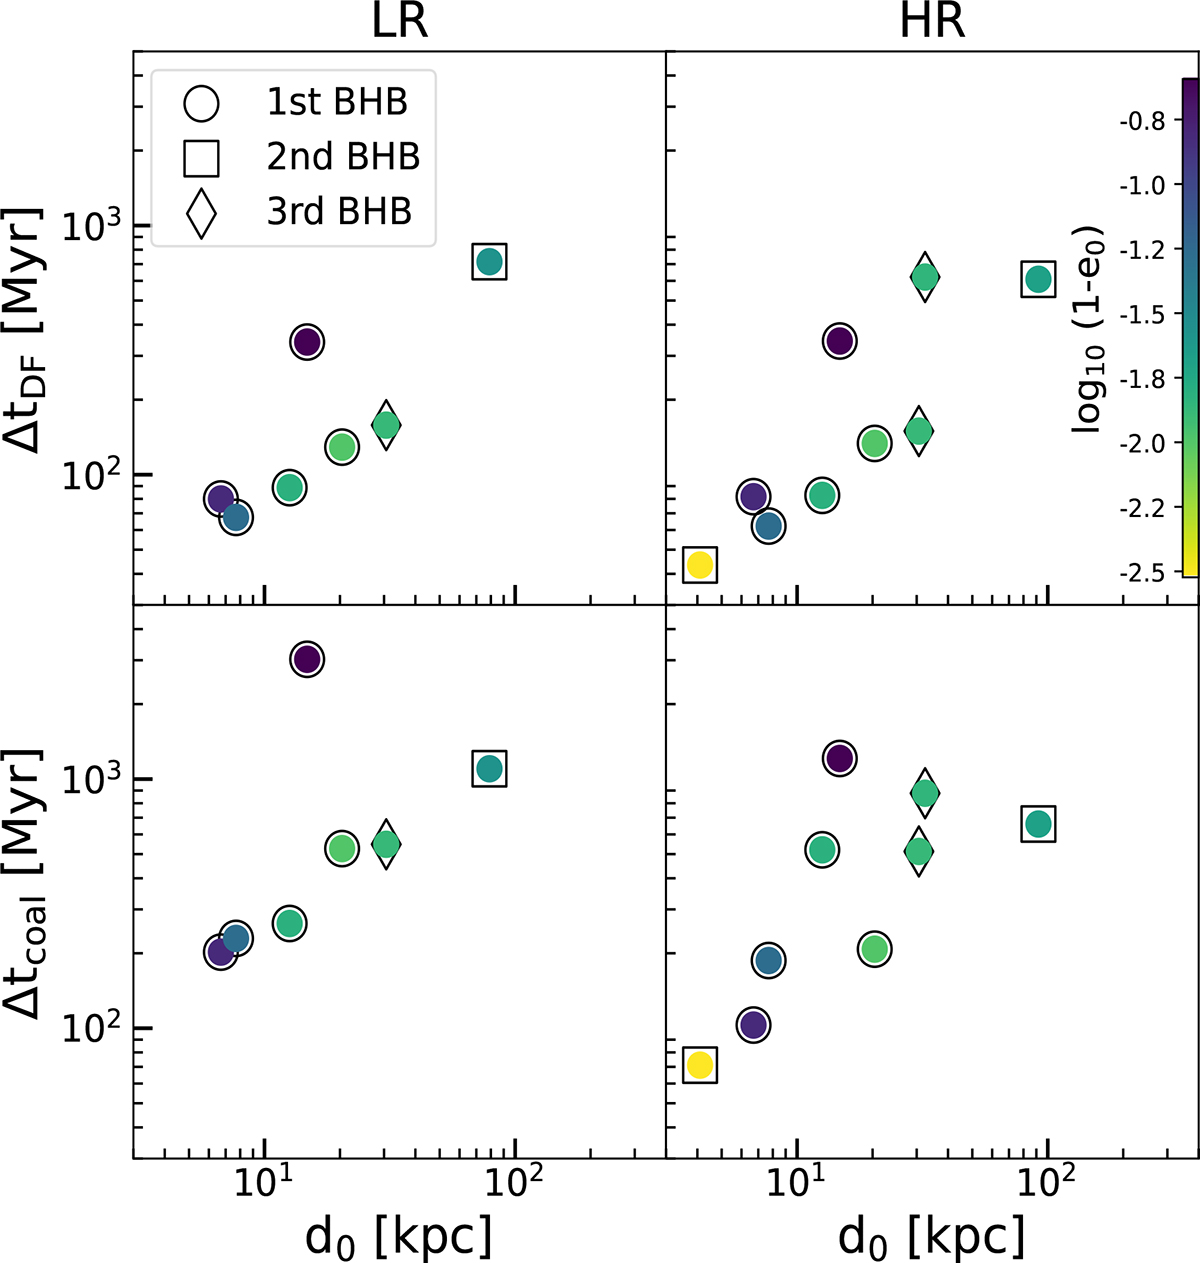
Fig. 2.
Download original image
For each BHB formed, we plot the dynamical friction timescale (ΔtDF = tb − t0, top panels), and the total coalescence time (Δtcoal = tcoal − t0, bottom panels) as a function of the initial distance between the progenitor galaxies (d0). Data are colour-coded according to the initial eccentricity of the galactic merger. Note that we chose to use log10(1 − e0) to make the colour gradient clearer, so the colour bar goes from high (yellow) to low (blue) eccentricity values. Panels on the left refer to LR runs, while panels on the right show data from their HR counterparts. Empty circles, squares, and diamonds represent the first, second, and third binary in each tree, respectively.
Current usage metrics show cumulative count of Article Views (full-text article views including HTML views, PDF and ePub downloads, according to the available data) and Abstracts Views on Vision4Press platform.
Data correspond to usage on the plateform after 2015. The current usage metrics is available 48-96 hours after online publication and is updated daily on week days.
Initial download of the metrics may take a while.