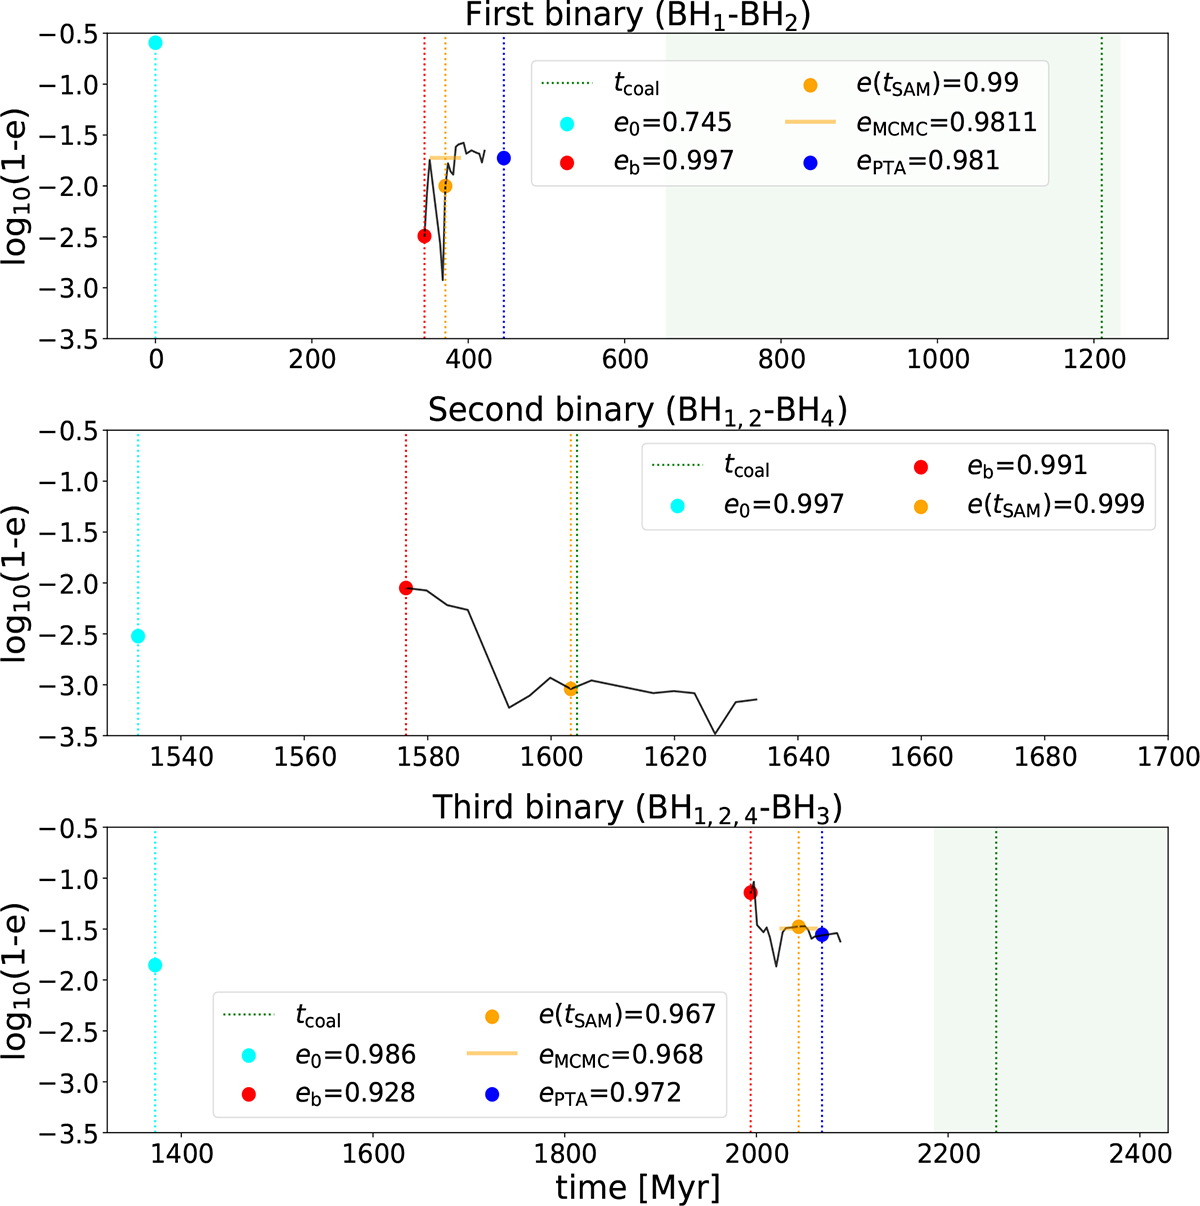
Fig. 3.
Download original image
Evolution of the orbital eccentricity of the first (top panel), second (middle panel), and third (bottom panel) BHBs formed in Tree 197109-HR. We highlight with vertical coloured lines the key times in the binary’s evolution: the initial time of the galactic merger (t0, cyan), time of binary formation (tb, red), time at which we start the SAM (tSAM, orange), time when the binary enters the PTA band (tPTA, blue), and time of coalescence (tcoal, green). For each time, we also report the corresponding eccentricity value, plotted as a point, following the same colour scheme. The horizontal orange line denotes the MCMC best-fit value of the initial eccentricity used for the semi-analytical evolution.
Current usage metrics show cumulative count of Article Views (full-text article views including HTML views, PDF and ePub downloads, according to the available data) and Abstracts Views on Vision4Press platform.
Data correspond to usage on the plateform after 2015. The current usage metrics is available 48-96 hours after online publication and is updated daily on week days.
Initial download of the metrics may take a while.