Fig. 4.
Download original image
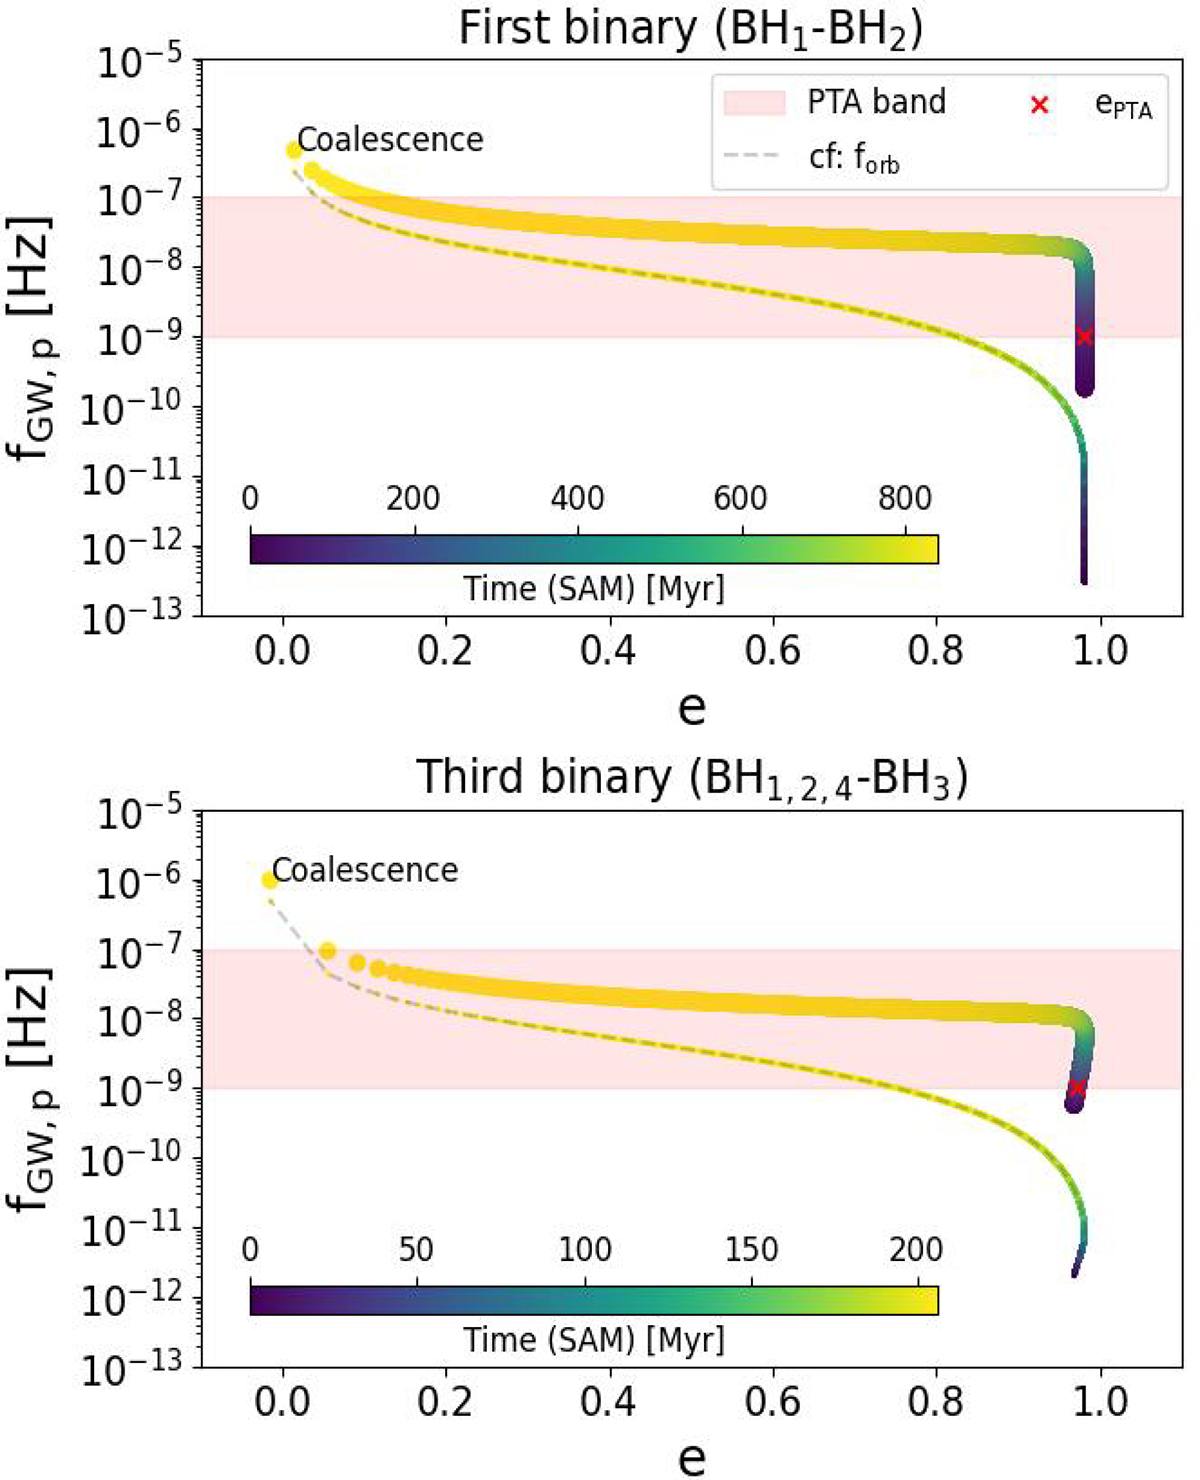
Semi-analytical evolution of the first (top panel) and third (bottom panel) binary of tree 197109-HR in the fGW, p−eccentricity plane. The dashed grey line shows the evolution of the orbital frequency (forb), as a way to compare it with fGW, p. All the data points are colour-coded to indicate elapsed time (from t0,SAM = 0 to coalescence, for each binary). We use a red cross to highlight when the binaries enter the PTA band (shaded red area).
Current usage metrics show cumulative count of Article Views (full-text article views including HTML views, PDF and ePub downloads, according to the available data) and Abstracts Views on Vision4Press platform.
Data correspond to usage on the plateform after 2015. The current usage metrics is available 48-96 hours after online publication and is updated daily on week days.
Initial download of the metrics may take a while.