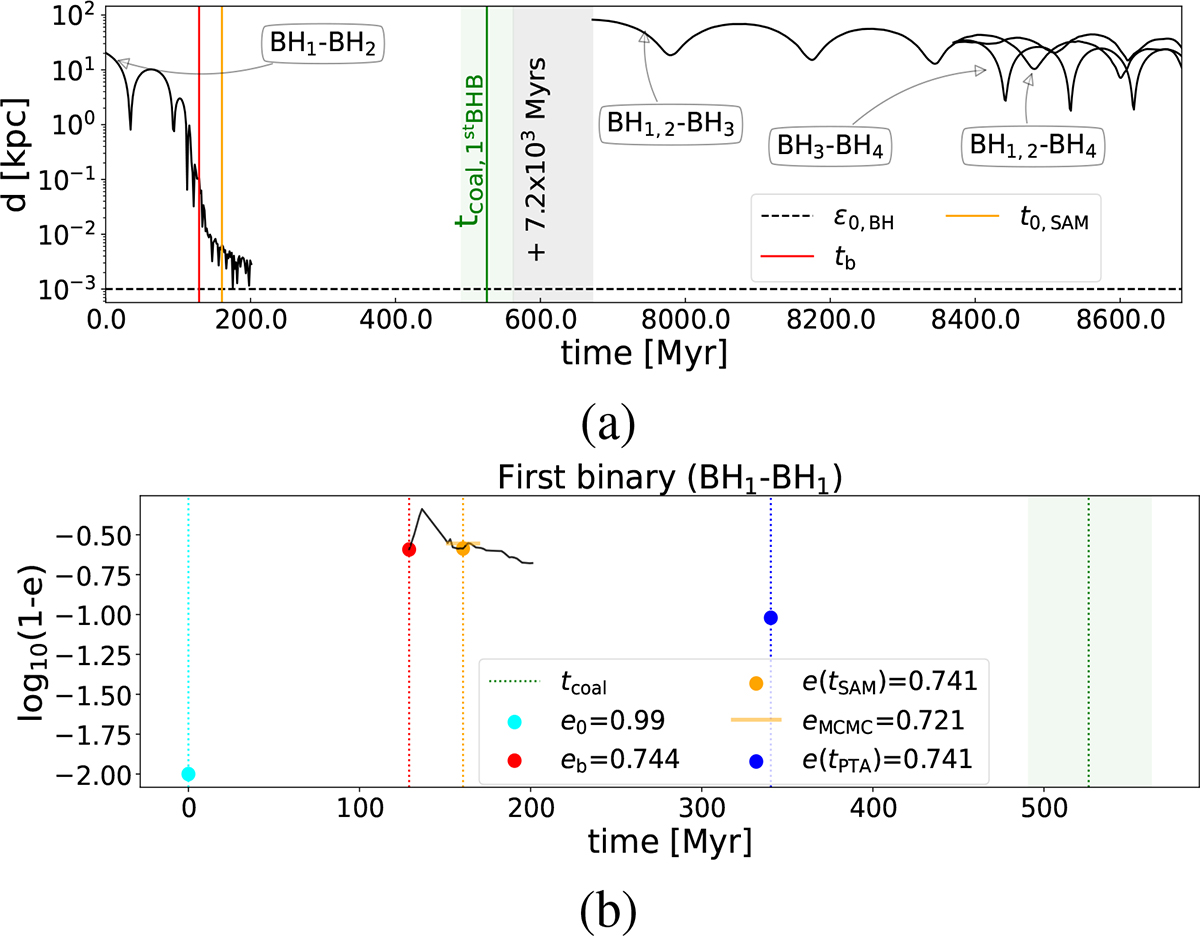
Fig. A.1.
Download original image
(a) Merger tree 17187-LR: time evolution of the BHs separation in Griffin simulations. The horizontal dashed black line indicates the softening of BHs particles in our simulation. Vertical coloured lines highlight key evolutionary times: initial galactic merger time (cyan), time of binary formation (red), time when we start the SAM (orange), and time of coalescence (green). The shaded green area represents the error on the predicted coalescence time, while the grey area denotes a jump in time of 7.2 × 10³ Myr, used to make the plot clearer. (b) Evolution of the orbital eccentricity of the first BHB (BH1 and BH2) formed in Tree 17187-LR. Vertical lines are coloured according to the same colour scheme as in panel (a). The vertical blue line shows when the binary is predicted to enter the PTA band by the SAM. For each key time, we plot the value of the orbital eccentricity with a point of the corresponding colour. The horizontal orange line denotes the MCMC best-fit value of the initial eccentricity used for the semi-analytical evolution.
Current usage metrics show cumulative count of Article Views (full-text article views including HTML views, PDF and ePub downloads, according to the available data) and Abstracts Views on Vision4Press platform.
Data correspond to usage on the plateform after 2015. The current usage metrics is available 48-96 hours after online publication and is updated daily on week days.
Initial download of the metrics may take a while.