Fig. 10
Download original image
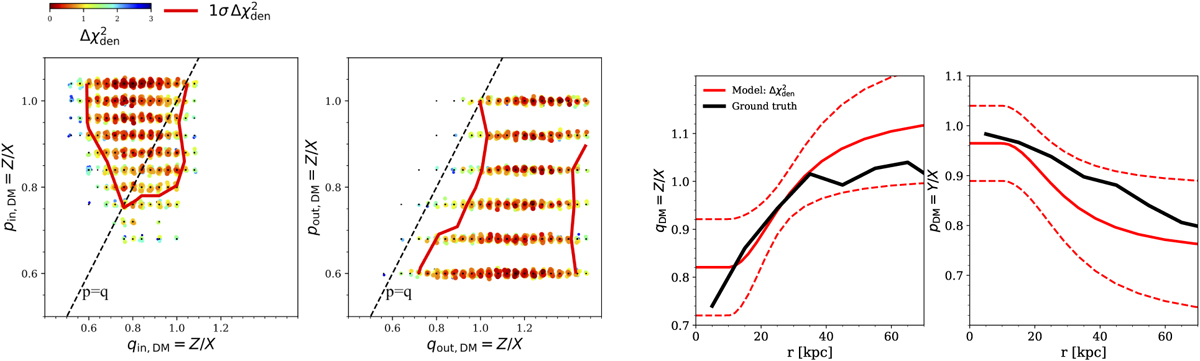
Left: constraints on qin,DM, pin,DM, qout,DM, and pout,DM for model allowing DM axis ratios to vary as a function of radius for Auriga 12. Right: comparison of pDM(r) and qDM(r) profiles obtained by the model (red) and the ground truth (black). The solid and dashed red curves represent the mean and 1σ uncertainty of the results obtained by the model.
Current usage metrics show cumulative count of Article Views (full-text article views including HTML views, PDF and ePub downloads, according to the available data) and Abstracts Views on Vision4Press platform.
Data correspond to usage on the plateform after 2015. The current usage metrics is available 48-96 hours after online publication and is updated daily on week days.
Initial download of the metrics may take a while.