Fig. 11
Download original image
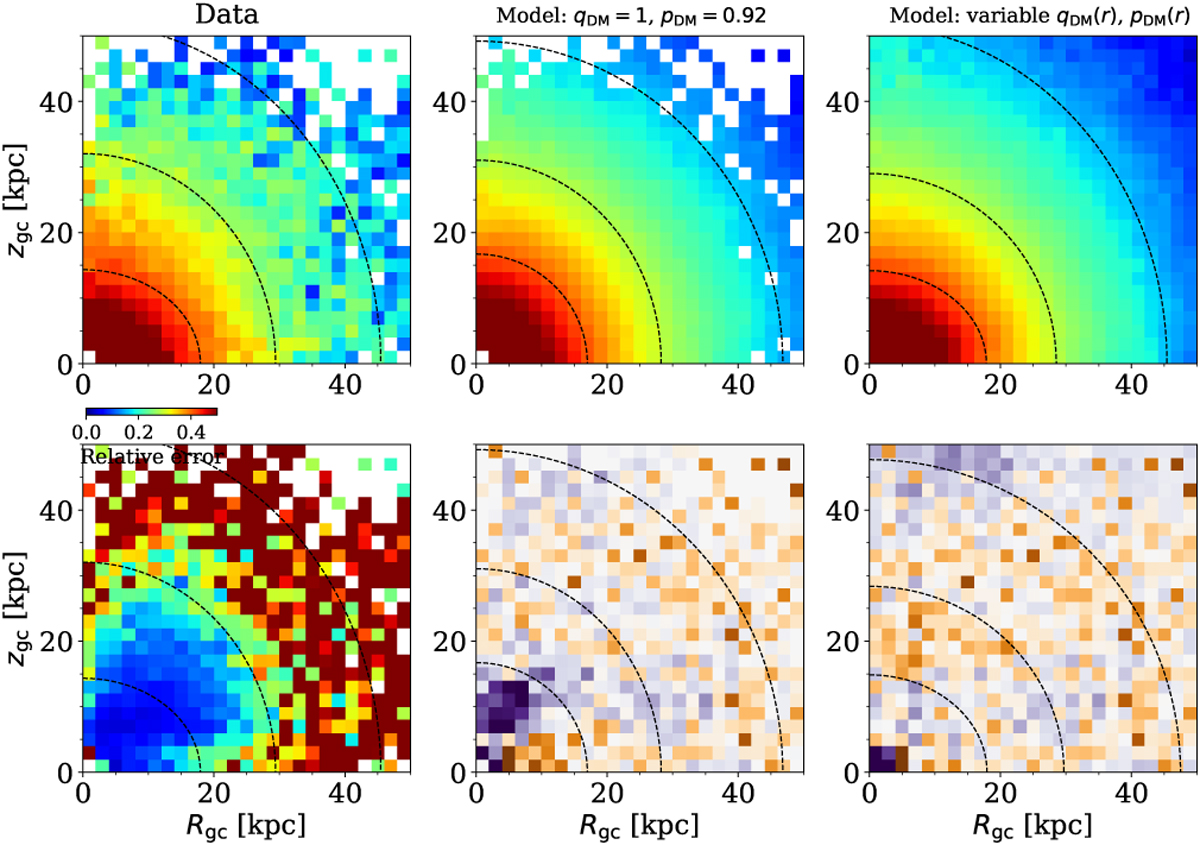
Comparison of stellar-density distribution constructed from data and different models for Auriga 12. The columns from left to right are the data, best-fitting model with constant pDM and qDM, and best-fitting model with pDM(r) and qDM(r) varying as a function of radius, r. The model with constant pDM and qDM cannot match the density distribution in all radial regions; there are significant residuals in the inner 20 kpc. The consistency between data and model improves with the model allowing variable pDM(r) and qDM(r).
Current usage metrics show cumulative count of Article Views (full-text article views including HTML views, PDF and ePub downloads, according to the available data) and Abstracts Views on Vision4Press platform.
Data correspond to usage on the plateform after 2015. The current usage metrics is available 48-96 hours after online publication and is updated daily on week days.
Initial download of the metrics may take a while.