Fig. 3
Download original image
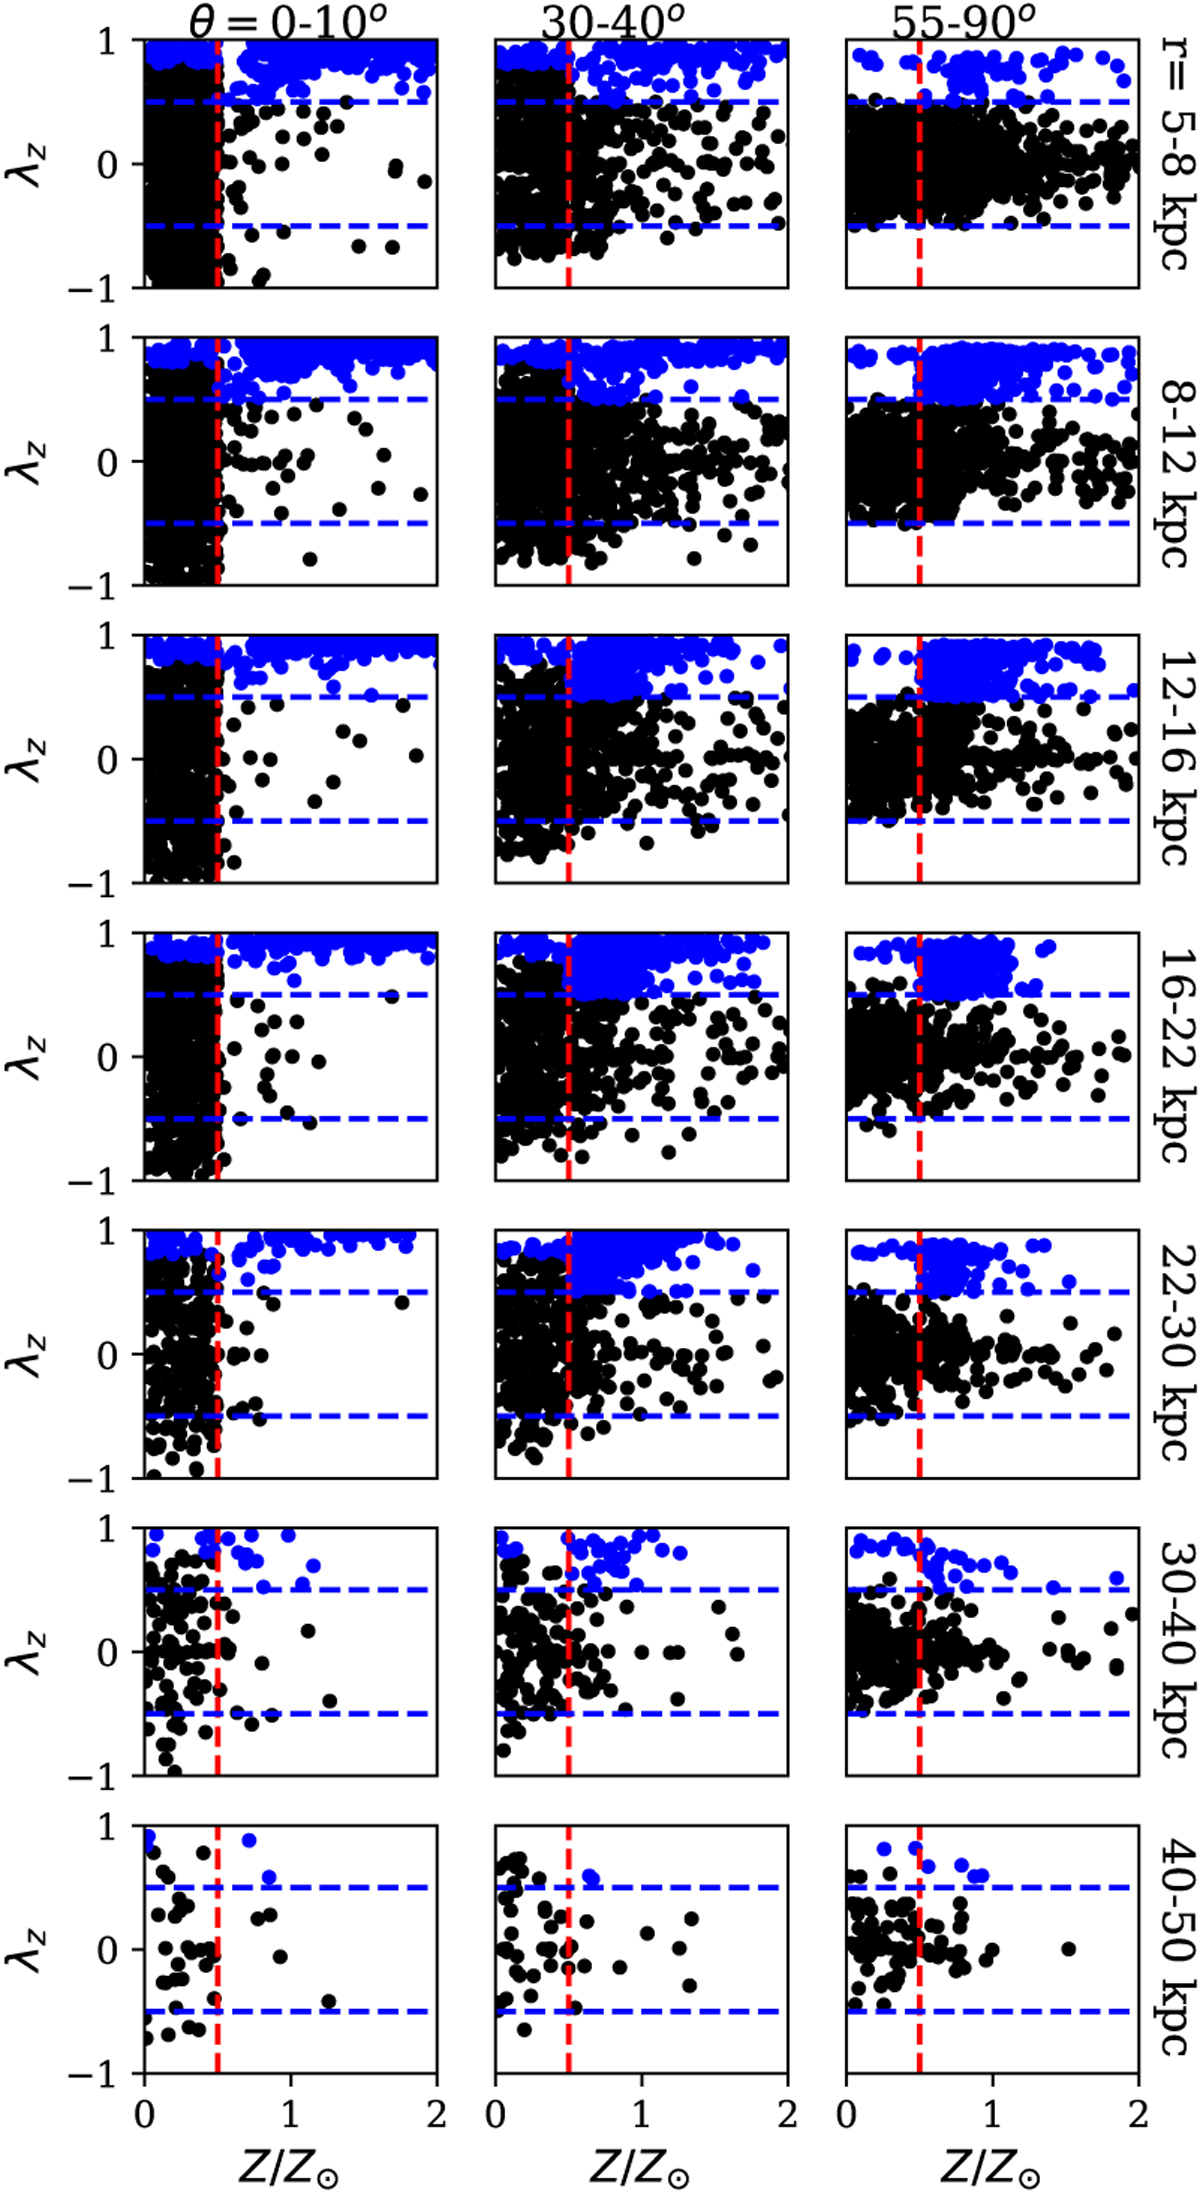
Mock data for Auriga 23. The blue dots are disc stars that we excluded, i.e. stars with λz > 0.8 or stars with λz > 0.5 and Z/Z⊙ > 0.5. The black dots are taken as halo stars and kept in our sample. We divided the data into 7 × 6 bins in rgc versus θ with the intervals of rgc = [5, 8, 12, 16, 22, 30, 40, 50] kpc, θ = [0, 10, 20, 30, 40, 55, 90°]; here, we only show three columns to illustrate the data.
Current usage metrics show cumulative count of Article Views (full-text article views including HTML views, PDF and ePub downloads, according to the available data) and Abstracts Views on Vision4Press platform.
Data correspond to usage on the plateform after 2015. The current usage metrics is available 48-96 hours after online publication and is updated daily on week days.
Initial download of the metrics may take a while.