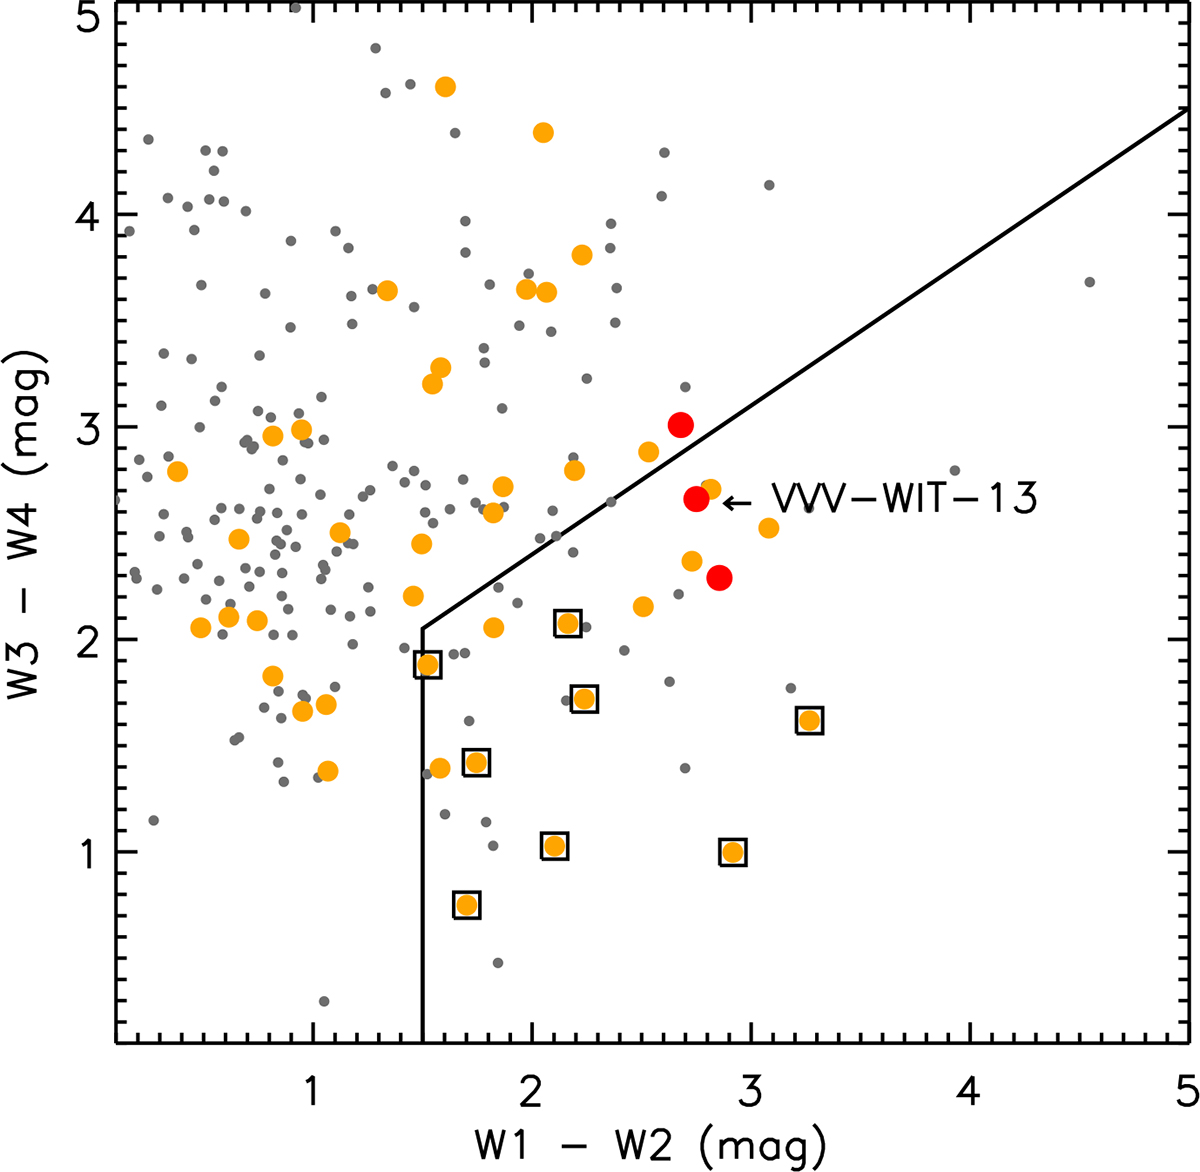
Fig. B.2.
Download original image
ALLWISE colour-colour diagram of sources from SPICY group G342.1+0.2. Data points are colour-coded by their VVV Ks amplitude, as ΔKs < 1 (grey), 1 ≤ ΔKs < 3 (orange), and ΔKs ≥ 3 (red). Mira candidates are marked by squares. The solid lines are boundaries between regions more populated with YSOs (upper left) and Miras (bottom right).
Current usage metrics show cumulative count of Article Views (full-text article views including HTML views, PDF and ePub downloads, according to the available data) and Abstracts Views on Vision4Press platform.
Data correspond to usage on the plateform after 2015. The current usage metrics is available 48-96 hours after online publication and is updated daily on week days.
Initial download of the metrics may take a while.