| Issue |
A&A
Volume 703, November 2025
|
|
|---|---|---|
| Article Number | A141 | |
| Number of page(s) | 16 | |
| Section | Stellar structure and evolution | |
| DOI | https://doi.org/10.1051/0004-6361/202556048 | |
| Published online | 13 November 2025 | |
VVV-WIT-13: An eruptive young star with cool molecular features
1
Instituto de Física y Astronomía, Universidad de Valparaíso, ave. Gran Bretaña, 1111, Casilla, 5030
Valparaíso, Chile
2
Millennium Institute of Astrophysics, Nuncio Monseñor Sotero Sanz 100, Of. 104, Providencia, Santiago, Chile
3
Centre for Astrophysics Research, University of Hertfordshire, Hatfield, AL10 9AB
UK
4
Department of Physics and Astronomy, University College London, Gower Street, London, WC1E 6BT
UK
5
Nicolaus Copernicus Astronomical Center, Polish Academy of Sciences, Rabianska 8, 87-100
Toruń, Poland
6
Departamento de Física, Universidad Técnica Federico Santa María, Avenida España 1680, Valparaíso, Chile
7
School of Physics and Astronomy, University of Leicester, Leicester, LE1 7RH
UK
8
Fakultat fur Physik, Universitat Duisburg-Essen, Lotharstraße 1, D-47057
Duisburg, Germany
9
Research Institute of Physics, Southern Federal University, Rostov-on-Don, 344090
Russia
10
INAF – Osservatorio Astronomico di Capodimonte, salita Moiariello 16, 80131
Napoli, Italy
11
Departamento de Fisica y Astronomia, Facultad de Ciencias Exactas, Universidad Andres Bello, Fernandez Concha 700, 8320000
Santiago, Chile
12
Vatican Observatory, V00120
Vatican City State, Italy
13
Centro de Astronomía (CITEVA), Universidad de Antofagasta, Av. Angamos 601, 02800
Antofagasta, Chile
14
Departamento de Física, Universidade Federal de Santa Catarina, Trindade, 88040-900
Florianopolís, SC, Brazil
15
University of Wyoming, 1000 E University Ave, Laramie, WY, USA
16
Cerro Tololo Inter-American Observatory, National Optical Astronomical Observatory, Casilla 603, La Serena, Chile
17
Department of Physics and Astronomy, Seoul National University, 1 Gwanak-ro, Gwanak-gu, Seoul, 08826
Republic of Korea
18
Research Institute of Basic Sciences, Seoul National University, Seoul, 08826
Republic of Korea
19
Department of Physics, University of Oxford, Keble Road, Oxford, OX1 3RH
United Kingdom
20
Department of Physics and Astronomy, University of the Western Cape, Bellville, 7535
South Africa
21
Chinese Academy of Sciences South America Center for Astronomy (CASSACA), National Astronomical Observatories, CAS, Beijing, 100101
China
22
Departamento de Astronomía, Universidad de Chile, Las Condes, 7591245
Santiago, Chile
23
Department of Astronomy, the University of Michigan, 1085 S. University, 323 West Hall, Ann Arbor, MI, 48109-1107
USA
24
Department of Astronomy, Tsinghua University, Beijing, 100084
People’s Republic of China
⋆ Corresponding author: This email address is being protected from spambots. You need JavaScript enabled to view it.
.
Received:
21
June
2025
Accepted:
16
September
2025
Abstract
Context. Outburst phenomena are observed at different stages of stellar evolution, due to the enhancement of the mass accretion rate on protostars or even stellar merger events. In the case of a young stellar object (YSO), the episodic mass accretion event plays an important role in the pre-main-sequence stellar mass assembly. Here we investigate an infrared eruptive source (RA = 16:53:44.38; Dec = − 43:28:19.47), identified from the decade-long VISTA Variables in the Vía Láctea survey (VVV). We named this target after a group of variable sources discovered by VVV, as VVV-WIT-13, where WIT stands for ‘What is this?’, due to its unique photometric variation behaviour and the mysterious origin of the outburst. This target exhibited an outburst with a 5.7 mag amplitude in the Ks-band, remained on its brightness plateau for 3.5 years, and then rapidly faded to its pre-eruptive brightness afterwards.
Aims. Our aim is to reveal the variable nature and outburst origin of VVV-WIT-13 by presenting our follow-up photometric and spectroscopic observations along with theoretical models.
Methods. We gathered photometric time series in both near- and mid-infrared wavelengths. We obtained near-infrared spectra during the outburst and decaying stages on XSHOOTER/VLT and FIRE/Magellan, and then fitted the detected molecular absorption features using models from ExoMol. We applied 2D numerical simulations to re-create the observables of the eruptive phenomenon.
Results. We observe deep AlO absorption bands in the infrared spectra of VVV-WIT-13, during the outburst stage, along with other more common absorption bands (e.g. CO). Our best-fit model suggests a 600 K temperature of the AlO absorption band. In the decaying stage, the AlO bands disappeared, whilst broad blue-shifted H2 lines arose, a common indicator of stellar wind and outflow. The observational evidence suggests that the CO and TiO features originate from an outflow or a wind environment.
Conclusions. We find that VVV-WIT-13 is an eruptive young star with instability occurring in the accretion disk. One favoured theoretical explanation of this event is a disrupted gas clump at a distance of 3 au from the source. If confirmed, this would be the first such event observed in real time.
Key words: stars: formation / stars: protostars / stars: variables: T Tauri / Herbig Ae/Be
© The Authors 2025
 Open Access article, published by EDP Sciences, under the terms of the Creative Commons Attribution License (https://creativecommons.org/licenses/by/4.0), which permits unrestricted use, distribution, and reproduction in any medium, provided the original work is properly cited.
This article is published in open access under the Subscribe to Open model. This email address is being protected from spambots. You need JavaScript enabled to view it. to support open access publication.
1. Introduction
In time-domain astronomy, bursts are a common type of transient phenomenon. They are often associated with sudden increases in mass accretion rate, as observed in young stellar objects (YSOs) and active galactic nuclei (Scaringi et al. 2015), or with close interactions between two astrophysical bodies, such as classical and dwarf novae (Poggiani 2024), in tidal disruption events (Rees 1988), or in planet engulfment scenarios (De et al. 2023). In particular, photometric surveys have discovered luminosity spreads among young clusters, which are a consequence of the episodic accretion scenario (Fischer et al. 2023). During the episodic accretion stage, the stellar mass accretion rate can increase by orders of magnitude. The duration and frequency of these high-accretion phases play a crucial role in stellar mass assembly. For instance, during the century-long outburst of FU Ori, the mass accretion rate has been enhanced by four to five orders of magnitude (Zhu et al. 2007). During these accretion bursts, the inner accretion disks are thoroughly heated, causing the snowlines of molecular species to move outwards (Ábrahám et al. 2009). This process creates opportunities for the growth of planetesimals and affects the formation of young planets (Jørgensen et al. 2020). Questions have been raised about the triggering mechanisms of the outbursts around young stars, particularly whether they can only happen under specific conditions, such as gravitational perturbations from a young giant planet.
Various physical mechanisms that trigger accretion bursts on young stars have been proposed, such as magneto-rotational instability (MRI; Armitage et al. 2001; Zhu et al. 2009; Elbakyan et al. 2021) and thermal instability (TI; Lodato & Clarke 2004; Nayakshin et al. 2024). Moreover, perturbations from a secondary body in the stellar system may also lead to accretion bursts, including the gravitational instability (GI) introduced by a stellar flyby (Cuello et al. 2019; Borchert et al. 2022) and an evaporating giant planet located in a close-in orbit (Nayakshin & Elbakyan 2024). Alternatively, in more evolved stellar systems without accretion disks, planet engulfment events can trigger a short-lived optical outburst (e.g. Stephan et al. 2020; De et al. 2023; Soker 2023), while the merger of stellar binaries results in red novae that last for months to years and at luminosities ≲106 L⊙ (Soker & Tylenda 2006; Kamiński et al. 2018).
In this work we present photometric and spectroscopic analyses of the infrared eruptive object VVV-WIT-13 (RA = 16:53:44.38; Dec = − 43:28:19.47). The acronym WIT stands for ‘What is this?’, indicating the mysterious nature of this source. The designation 13 belongs to a list of intriguing variables (e.g. Minniti et al. 2017; Lucas et al. 2020; Smith et al. 2021; Saito et al. 2023) discovered by the infrared VISTA Variable in the Via Lactea survey (VVV; Minniti et al. 2010). As with our previous discoveries, VVV-WIT-13 represents a challenging astrophysical problem. A few years passed after the discovery until we were able to gather enough ancillary data (in this case, additional photometry and spectroscopy) in order to be able to discard some of the varied scenarios and explanations that were initially proposed. The infrared variability of VVV-WIT-13 was originally reported in Contreras Peña et al. (2017a) as source VVVv746, with ΔKs= 1.27 mag between 2010 and 2014. Lucas et al. (2020) reported a ΔW1 = 5.26 mag outburst in this object in the mid-infrared WISE bands, under the name WISEA J165344.39-432819.2, classifying it as an eruptive young stellar object (YSO). More recently, this object was presented in a collection of VVV high-amplitude variable sources (with a burst of ΔKs = 5.67 mag) as L222_59 (Lucas et al. 2024). Our follow-up spectroscopic study discovered deep AlO absorption features in the near-infrared spectra of this source taken during the outburst stage (Guo et al. 2024a); these features had previously only been observed among the spectra of red nova outbursts and Miras (Banerjee et al. 2012; Kamiński et al. 2015; Steinmetz et al. 2024). Based on this, Guo et al. (2024a) classified L222_59 as a post-main-sequence nova-like object. However, this classification conflicts with the young characteristics of this source observed during the quiescent stage, prompting us to investigate the true nature of this unique eruptiveobject.
The VVV-WIT-13 is projected within the Galactic disk, associated with several star-forming regions visible in Spitzer images (see Figure 1). VVV-WIT-13 is located 6″ from the Galactic molecular cloud SDG G342.136+0.2045 (Duarte-Cabral et al. 2021). This molecular cloud has an approximate distance of 3.2 ± 0.5 kpc to the Solar System, estimated by the radial velocity of 13CO (2-1) emission. The far-infrared emission of this cloud was detected by Herschel (Peretto et al. 2016), which probably outshines the emission from the disk–envelope of VVV-WIT-13. Additionally, within a 5′ radius of VVV-WIT-13, there are five Herschel Hi-GAL clumps, the nearest of which is only 17″ away (HIGALBM 342.1366+0.2006; Elia et al. 2017). Based on a 2 kpc distance (see Mège et al. 2021), Elia et al. (2017) fitted a mass of 40 M⊙ for the nearest cold core. VVV-WIT-13 is also surrounded by several Galactic H II regions, such as GAL 342.09+00.42, G341.97+00.44, and G342.36+00.11 (see Figure 1). Based on our previous statistical studies, VVV-WIT-13 is likely a young star given the large number of star formation-related sources within a 5′ radius (see Figure 8 in Contreras Peña et al. 2017a). However, VVV-WIT-13 lacks any optical counterparts in existing photometric catalogues because it resides within a Spitzer dark cloud (G342.135+0.204; Peretto & Fuller 2009). According to previous investigations from the VVV survey, such an overlap has a chance of only 1% in the southern Galactic plane (Lucas et al. 2020) and therefore VVV-WIT-13 is likely associated with the IRdark cloud.
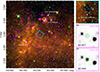 |
Fig. 1. Infrared images of the surrounding environment of VVV-WIT-13 (located in the centre and marked by the green circle in all frames). Left:Spitzer IRAC three-colour image (1 × 1 deg, blue: [4.5], green: [5.8], red: [8.0]), taken in 2004 during the pre-outburst stage, with Galactic longitude (l) and latitude (b). Sources belonging to the G342.1+0.2 YSO group, selected by SPICY, are marked by magenta circles. Upper right: Zoomed-in 5′ × 5′ Spitzer IRAC three-colour image, with the equatorial north-up orientation. Middle and bottom right: 1.2′ × 1.2′ W2-band images from unWISE (Lang 2014; Meisner et al. 2017), taken in 2017 and 2020. |
VVV-WIT-13 is classified as a candidate YSO based on its infrared colour indices from the Spitzer GLIMPSE survey, where it was originally named [RMB2008] G342.1371+00.2054 (Robitaille et al. 2008). In the SPICY YSO catalogue (Kuhn et al. 2021, SPICY ID 43459), it is identified as a flat-spectrum YSO, representing an intermediate stage between a protostar and a T Tauri star. The classification was based on the variability and the Spitzer infrared photometry taken in 2006. VVV-WIT-13 belongs to a spatial association of YSOs (SPICY G342.1+0.2) with 442 member sources along the Galactic disk plane. In this group, 91 members have counterparts (spatial separation less than 1″) in the Gaia DR3 data release (Gaia Collaboration 2023). After removing outliers in the proper motion and parallax (see Section 5.3), we found a median parallax of 0.487 mas, corresponding to a distance of 2.05 kpc. The 2 kpc median distance is consistent with the distance of the nearby gas clump HIGALBM 342.1366+0.2006 (Mège et al. 2021). The kinematic velocity of VVV-WIT-13 is expected to be VLSR = −22 km/s (Wenger et al. 2018) given the distance and Galactic location. Unless otherwise stated, we assume a distance of 2 kpc to theVVV-WIT-13.
2. Observational data
2.1. Photometric data and catalogues
2.1.1. Near-IR photometry
The VISTA Variables in Via Lactea survey (VVV) is a public survey of the European Southern Observatory (ESO), which obtained near-infrared photometric light curves of millions of sources towards the inner Galactic disk plane and the Galactic Centre from 2010 to 2016. The vast majority of the time series observations were taken in the Ks-band (2.15 μm), with a few multi-colour visits (Minniti et al. 2010). Starting in 2016, the VVV eXtended survey (VVVX), as an extension of VVV, obtained a dozen additional epochs of multi-colour photometry in the near-infrared, with a sky coverage that was twice as large as the original VVV field (see Minniti 2016; Saito et al. 2024). We obtained the VVV photometric measurements from the VIRAC2-β (VVV InfraRed Astrometric Catalogue) catalogue for detections in H- and Ks-bands (Smith et al. 2025). We resampled the Ks photometry to 1-day bins to increase the photometric accuracy. After removing outliers beyond 3σ of each bin, the final light curve comprises the median values from each bin. We also performed aperture photometry on Z-, Y-, and J-band VVV images. The photometric measurements in Y- (2011 epoch) and J-bands are listed in Table A.1.
We conducted two photometric observations on the ESO New Technology Telescope, using the Son OF ISAAC (SOFI) imager (Moorwood et al. 1998), in May 2021 and April 2022. In 2023, 2024, and 2025 we obtained photometric observations on the InfraRed Survey Facility (IRSF) telescope located at the South African Astronomical Observatory (Kato et al. 2007). In June 2025 we observed a single-epoch Ks photometry with the Rapid Eye Mount (REM) telescope at La Silla observatory, with a total exposure time of 3 × 5 × 15 s = 225 s. Moreover, we used the J-band acquisition image from the Magellan FIRE spectrograph as a photometric data point. Additionally, we conducted aperture photometry on the Ks-band image from the 2MASS survey extracted from the NASA/IPAC Infrared Science Archive.
We reduced the images by using custom-written pipelines. In each filter, the frames taken in each dithering cycle were shifted and co-added as a single image. Nearby field stars were selected as photometric references based on their brightness in each band and Ks-band stability from the VVV time series (δKs < 0.05 mag, standard deviation). Then, the relative magnitude of the target was extracted by aperture photometry methods similar to those in Guo et al. (2018). The measured brightness of our target is listed in Table A.1.
2.1.2. Archival infrared photometry
The pre-outburst infrared brightness of VVV-WIT-13 was measured by the Spitzer GLIMPSE (Galactic Legacy Infrared Mid-Plane Survey Extraordinaire) survey (Benjamin et al. 2003) and the 24 μm band in MIPSGAL (Carey et al. 2009). It was also detected in the ALLWISE (Wright et al. 2010) and NEOWISE (Mainzer et al. 2014) surveys. We downloaded mid-infrared photometric data from the NASA/IPAC Infrared Science Archive (IRSA1). Specifically, we obtained single-epoch WISE (Wide-field Infrared Survey Explorer) photometry and then averaged detections within three-day bins to increase the accuracy. At the fainter end of the W1-band time series (> 12 mag), the intrinsic spread of individual magnitude measurements within one bin becomes larger than the error. Therefore, we used the standard deviation within one bin (σ) as the error of each binned epoch. Additionally, data points located outside 3σ of each bin were eliminated before calculating the average. The unWISE images shown in Figure 1 are downloaded from the wiseview online tool2. There is no Herschel Hi-Gal detection of this source; it is likely shadowed by the nearby gas clump HIGALBM 342.1366+0.2006 (Elia et al. 2021).
2.2. Spectroscopic observations and data reduction
We acquired four near-infrared spectra of VVV-WIT-13: two epochs in 2021 during the brightness plateau, one spectrum taken in 2023, and a final epoch obtained in early 2024. The epochs are marked on the light curve in Figure 2.
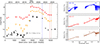 |
Fig. 2. Left: Infrared light curves (Ks-, W1-, and W2-band) of VVV-WIT-13. The W1-band error bars (orange) are the standard deviation of the magnitude spread in each epoch before binning. The typical error bar in the Ks-band (< 0.1 mag) is smaller than the symbol size. A sinusoidal fitting result is presented by the grey line. The spectroscopic epochs are marked by the vertical dashed lines with the same colour scheme as in the right panels. Right: Near-infrared spectra of VVV-WIT-13 obtained in 2021, 2023, and 2024. The key spectral features are labelled on the plot. |
On 29 April and 3 May 2021, we obtained two optical to near-infrared spectra of VVV-WIT-13 using the XSHOOTER spectrograph mounted on the European Southern Observatory Very Large Telescope, under the service mode (PI: Lucas). The visible (VIS) and near-infrared (NIR) arms of XSHOOTER were used, with a 0.9″ slit width in the optical (R = 8900) and a 0.6″ slit in the NIR arm (R = 8100). The spectra were extracted by the ESO pipeline with heliocentric correction (Vernet et al. 2011; Freudling et al. 2013) and the telluric absorption features were corrected by the MOLECFIT software (Smette et al. 2015; Kausch et al. 2015). We obtained rough flux calibration using the SOFI photometry taken on 7 May 2021, assuming no short-timescale variability. These two spectra were originally published in Guo et al. (2024a) as part of the spectroscopic follow-up campaign of a group of high-amplitude variable sources. In this work, we combined these two spectra to increase the signal-to-noise ratio, as no variability was found between the two epochs.
A near-infrared spectrum was taken during the fading stage of this source in July 2023 (PI: Guo) with the FIREspectrograph (Simcoe et al. 2013) on the Magellan Baade Telescope at Las Campanas Observatory. We used the 0.6″ slit (R = 6000) with a wavelength range between 0.8 and 2.5 μm and a spatial resolution of 0.18 arcsec per pixel. An A0V telluric standard star with the same airmass was observed after the scientific exposures for telluric correction. The FIRE data was reduced using the FIREHOSE V2.0 pipeline (Gagne et al. 2015). Additional custom-designed programs were applied to obtain accurate wavelength calibrations using OH skylines and to fix the discontinuity between the spectral orders. Finally, only H and K bandpass spectra are presented in this work (1.45 to 2.45 μm), as the J spectra have a low signal-to-noise ratio (S/N < 2; see details of our spectroscopic data reduction methods in Guo et al. 2020, 2021).
Another XSHOOTER spectrum was obtained using the ESO Director’s Discretionary Time on 16 March 2024 (PI: Kaminski). The same data reduction was applied as for the earlier XSHOOTER spectra. The spectra of VVV-WIT-13 are presented in Figure 2 with spectral epochs marked on the light curves.
3. Photometric results
In this section we present the photometric results of VVV-WIT-13, including its infrared colour indices, the spectral energy distribution, and its photometric variability. In most parts of this section we assume a young nature of VVV-WIT-13 as indicated by its spatial location.
3.1. Infrared colour indices of VVV-WIT-13
Infrared colours provide essential information on stars, such as the evolutionary stages and line-of-sight extinction in the case of YSOs Lada (1987). Here we measured the quiescent and outburst colours of VVV-WIT-13 using the photometric data and compared them with catalogued YSOs. The quiescent near-infrared colours of VVV-WIT-13 (J − H= 3.02 mag; H − KS= 1.99 mag) indicate that it is an embedded YSO, located between the Class I and II stages (see Figure 3). This is consistent with the classification from the SPICY catalogue based on the mid-infrared Spitzer spectral energy distribution (SED). We estimated the extinction of VVV-WIT-13 as AV ∼ 17 mag, assuming that the de-reddened quiescent colour indices agree with normal disk-bearing YSOs (Meyer et al. 1997) and using the extinction law from Wang & Chen (2019). For comparison, in Figure 3 we present the infrared colours of members of the SPICY group G342.1+0.2 and FUor-type objects published in Guo et al. (2024a). The majority of the YSO candidates have similar colours to reddened Class I/II YSOs.
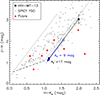 |
Fig. 3. Near-infrared colour-colour diagram of YSOs from the VVV survey. VVV-WIT-13 is marked by the black circles (filled: quiescent; open: outburst). Other members in the SPICY group G342.1+0.2 are presented by the grey dots. A selection of VVV FUor-type eruptive sources are shown in red. The dashed line represents the synthetic locus of Class II YSOs (Meyer et al. 1997). The dotted and solid lines are extinction vectors from Wang & Chen (2019). |
The near-infrared colours of VVV-WIT-13 during the outburst are J − H= 2.06 mag and H − Ks= 1.56 mag. Both indices are bluer than the pre-outburst quiescent stage, in line with the brighter and bluer trend of eruptive YSOs. On the colour-colour diagram, we found a coincidence between the colour change of this outburst and the extinction vector. However, the H- and Ks-band amplitudes (ΔH = 5.28 mag and ΔKs = 4.85 mag) do not follow the extinction law (AH = 1.67AKs).
The classification of YSOs based on infrared colours is often contaminated by the post-main-sequence asymptotic giant branch (AGB) stars. To separate YSOs and post-main-sequence sources, Robitaille et al. (2008) developed empirical cuts on the Spitzer colours3. The Spitzer colours of VVV-WIT-13 agree with YSO instead of the AGB identification. In previous publications, we distinguished YSOs and Miras based on their infrared variability and drew regions of Miras/YSOs on the WISE colour-colour and colour-magnitude diagrams (Lucas et al. 2017; Guo et al. 2022). On the WISE colour-colour diagram, the quiescent colour of VVV-WIT-13 is located beyond the region occupied by AGB stars and near the boundary between Miras and YSOs. We examined the periodicity of the Ks-band light curves of group members of SPICY G342.1+0.2 and discovered eight Mira candidates. All eight Mira candidates have different locations on the WISE colour-colour diagram than VVV-WIT-13 (see Figure B.2).
3.2. Spectral energy distribution of VVV-WIT-13
The infrared SED is a common tool for identifying young stars with a circumstellar disk or envelope. Sources at earlier evolutionary stages (i.e. protostars) exhibit excess emission at longer wavelengths. A combination of high line-of-sight extinction and thermal emission from the accretion disk–envelope contributes to the infrared excess (Lada 1987). In this work, we used the pre-outburst and quiescent near- to mid-infrared SED (between 0.8 to 24 μm) to classify VVV-WIT-13 and to estimate its bolometric luminosity. The following discussions assume that VVV-WIT-13 is a young star undergoing an outburst since 2018. The quiescent SED is composed of J, H, and Ks VVV photometry obtained in the year 2010; ALLWISE photometry taken in 2010; and Spitzer data observed in 2004. The outburst SED includes photometric measurements from SOFI and NEOWISE. We also added VISTA Z- and Y-band flux via integrating the XSHOOTER spectrum through the filter transmission curves (Rodrigo et al. 2012).
The quiescent SED (see Figure 4) has a rising slope from near- to mid-infrared, consistent with an embedded young star. Differences are seen between flux measured in Spitzer and WISE bands, consistent with low-amplitude fluctuation seen during the quiescent stage. We estimated the bolometric luminosity of VVV-WIT-13 as 0.9 L⊙, assuming a 2 kpc distance and a high line-of-sight extinction (AV = 17 mag). The 0.9 L⊙ luminosity is common among accreting young stars, indicating a stellar mass of 0.4–0.6 M⊙. Here we assumed a an age of 0.5–1 Myr based on the models from Baraffe et al. (2015). However, this is a rough estimation since the distance and extinction measurements both have large uncertainties. When applying a closer distance (e.g. 1 kpc), the bolometric luminosity would drop by 0.60 dex, leading to a lower stellar mass estimation of 0.2 M⊙. Moreover, the absence of long-wavelength measurements (λ > 24 μm) in the SED further increases the uncertainty of the luminosityestimation.
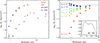 |
Fig. 4. Left: Spectral energy distribution (SED) of VVV-WIT-13 with data obtained from VVV, SOFI, Spitzer, WISE, and integrated spectra. The pre-outburst SED is shown as dots, and the in-outburst SED is shown as squares. Right: In-outburst SED of VVV-WIT-13 dereddened with AV ranging from 0 to 17 mag. As a comparison, we present the high-mass accretion SED calculated by Bell (1999). We scaled the model to match the SED of VVV-WIT-13, as presented by the dashed line. Error bars smaller than the size of the symbols are not presented. |
During the outburst, the estimated bolometric luminosity was 55 L⊙, which is comparable with classical FUor-type eruptive objects (e.g. FU Ori, V960 Mon, and V733 Cep), discovered through optical surveys (see Table 2 in Connelley & Reipurth 2018). Even assuming a lower extinction (e.g. AV = 9 mag), the bolometric luminosity still reaches 7.6 L⊙, which remains much brighter than that of a normal low-mass pre-main-sequence star. We note here that the outburst SED of VVV-WIT-13 has an outstanding difference compared with bona fide FUors, as the mid-infrared outburst amplitudes of VVV-WIT-13 are comparable to or even greater than the near-infrared. However, we have not yet considered the effect of the variable line-of-sight extinction. Furthermore, the geometry and evolutionary stage (i.e. protostar vs. pre-main-sequence star) are unknown, which also complicates the overall interpretation of this source.
In Figure 4, we present the extinction-corrected SED (λFλ) of VVV-WIT-13. The upper limit of the extinction is set to AV = 17 mag according to the extinction estimated from the near-IR colour-colour diagram (see Figure 3). In the AV = 17 mag case, we found the SED peaks in optical, with a flat transition between near-IR to mid-IR, which resembles the high-mass accretion scenario calculated in Bell (1999). In this model Bell (1999) assumed a hot inner accretion disk with an exceptionally high mass accretion rate at 10−4 M⊙ yr−1, which extends to the star (see the inset in the right panel of Figure 4). In addition to the maximum at 0.6 μm, there is a secondary bump at 6 μm, due to the passive-heated disk at ∼0.5 au reprocessing radiation from the inner active accretion disk. In this case, the disk temperature at 0.1 au would reach 2000 K and drop to 1000 K at a distance of 1 au. Nevertheless, there is a large uncertainty in the extinction estimation for two reasons. First, the high extinction (AV = 17 mag) is estimated based on the pre-outburst near-infrared colours with empirical colours of YSOs, which might be biased by the intrinsic colours of our target. Second, there are a few examples of line-of-sight extinction that have been cleared or enhanced after an outburst of a YSO (e.g. Guo et al. 2024b). We conclude that, under the assumption of AV = 17 mag, the outburst SED of VVV-WIT-13 resembles a hot inner disk, which is typical for FUor-type outbursts (e.g. Zhu et al. 2007). With a lower extinction estimation, such as AV = 9 mag (estimated by the colour during the outburst), the SED still peaks in the mid-infrared, which does not resemble the classical FUor-type disk. In this case, we assume the existence of a warm disk, but without the presence of a hot inner part.
3.3. Photometric variability
During the pre-outburst stage, VVV-WIT-13 had low-amplitude variation with ΔKs = 1.5 mag over a 2000 d timescale. Although most YSOs exhibit photometric variation due to inhomogeneous cold or hot spots, accretion and extinction changes, such a large amplitude is uncommon. For instance, among the 442 young members of the SPICY group G342.1+0.2, only 30 sources (6.8%) reached ΔKs > 1.5 mag (Appendix B). The pre-outburst variation amplitude is also greater than the majority of pre-outburst variation of long-duration eruptive YSOs (see Table 4 in Guo et al. 2024a). We extracted a sinusoidal fluctuation (P = 1748 ± 141 d; see Figure 2) on the Ks time series by the Lomb-Scargle periodogram (Zechmeister & Kürster 2009). However, the authenticity of this period cannot be verified, since only one period is detected. This fluctuation is also seen in the mid-IR with ΔW1 = 1.6 mag and ΔW2 = 0.5 mag, which cannot be explained as a change in line-of-sight extinction. We suspect that the pre-outburst variability is linked to the existence of a temporary disk structure as a consequence of a tidal disruption of a large body. The 1748 d period is consistent with the Keplerian rotational timescale at a distance of 2.8 au around a 1 M⊙ star.
As recorded by the VVV and NEOWISE light curves, an outburst started after 25 August 2016 and rapidly reached a brightness plateau within 1 year. Limited by the cadence of the time series, the rising timescale is between 180 and 360 d. The amplitudes of the rising stage reached 3.0 mag in W2 and 4.5 mag in Ks. Such a high amplitude and rapid-rising stage places this outburst among bona fide FUors (Guo et al. 2024a). Although the eruptive amplitude is similar to Galactic stellar merger events (red novae; see Kaminski 2024), the duration of the rising stage of VVV-WIT-13 is much longer than those of stellar mergers (10–180 d, e.g. Bond et al. 2003; Tylenda et al. 2011) and planet engulfment events (10 d; De et al. 2023), but it is comparable to one particularly slow red nova, BLG-360 (Tylenda et al. 2013). This object is very different to VVV-WIT-13 (Steinmetz et al. 2025).
Approximately 1000 days after reaching its maximum, VVV-WIT-13 entered a fading stage. The duration of the outburst stage is shorter than the decades-long classical FUor-type, longer than EXor-type outbursts (timescale of 1 yr and lower infrared amplitude), and much longer than the brightness plateaus of red novae (timescale of 100–200 d; Pastorello et al. 2019). This intermediate eruptive timescale resembles individual events seen in V1647 Ori (Briceño et al. 2004), VVVv322 (Contreras Peña et al. 2017a), VVV1636-4744 (Guo et al. 2024a), and Source 1017 (Morris et al. 2025). Recent photometric studies suggest that this kind of intermediate-duration outburst may be as common as classical FUors and EXors among embedded sources (Contreras Peña et al. 2024; Morris et al. 2025). We infer that the accreting object of these multi-year-long outbursts must be relatively compact compared with the decades-long FUor-type events. Although we lack high-cadence photometric data, we found that the starting point of the decaying stage is not contemporaneous for the Ks- and WISE bands, as the mid-IR brightness faded approximately 1 yr earlier than the near-IR. Based on the last photometric data point in Figure 2, the brightness of VVV-WIT-13 has reached another plateau since 2024, about 1 mag brighter than the pre-outburst stage. Future photometric monitoring is crucial to determine the full duration of this eruptive event.
4. Spectroscopic features and molecular models
The spectroscopic features during an outburst contain crucial information such as the temperature and radial velocity of the system. The infrared spectra of most FUor-type outbursts have molecular absorption bands resembling the photosphere of cool stars (Connelley & Reipurth 2018). Specifically, CO and water vapour absorption are the most common molecular features among FUor-type outbursts. The CO gas temperature often reaches T = 2000 − 4000 K (e.g. Contreras Peña et al. 2017b; Liu et al. 2022). The blue-shifted CO absorption on an eruptive YSO, V1057 Cyg, is thought to originate from an expanding shell of CO gas, ejected from the eruptive YSO at the centre (Hartmann et al. 2004). In this section we present the detailed spectroscopic features and their evolution throughout different stages of the outburst.
4.1. The in-outburst spectrum
During the outburst, VVV-WIT-13 displayed deep molecular absorption features, including TiO in optical, AlO in J and H bandpass, and 12CO bandhead beyond 2.3 μm. H I, He I, and metal lines are also observed in absorption. In the following paragraphs, if not specifically noted, CO stands for the 12CO molecule and the radial velocity is measured in the heliocentric frame. Given the Galactic location of our target, the VLSR correction from Vhelio is 6.8 km/s.
We fit the molecular absorption features using the synthetic grid spectra from the cross-sections provided by the ExoMol database (Patrascu et al. 2015; Tennyson et al. 2016; Bowesman et al. 2021). This is equivalent to absorption spectra produced by a plane-parallel slab of gas in the local thermal equilibrium and optically thin case. We first removed the infrared continuum by applying polynomial functions to the spectrum. The continuum-removed spectrum is presented in the upper left panel of Figure 5. Four parameters were estimated for each molecular band, including the excitation temperature (T), the radial velocity in the heliocentric frame (RV), and the column density of each molecular species (N). The best-fit results are presented in Table 1. Compared to common FUors (Guo et al. 2021), the CO detected on VVV-WIT-13 has a low temperature (T = 1300 K), indicating either an envelope or outflow origin. Similarly, the AlO bands require a cool temperature of 600 K. We discuss these molecular features further in Sect. 4.2. There is no obvious detection of 13CO absorption bandheads, which are usually seen among evolved stars enhanced in nucleosynthesis products (see Guo et al. 2024a). We note that weak 13CO absorption (ν′-ν″, 2-0) has been observed on FU Ori and V1057 Cyg (Connelley & Reipurth 2018). At the 12C/13C this is a ratio here abundance of 30–90 in the local ISM (Yan et al. 2023), a firm detection of 12CO features in the first overtone bands requires both very high sensitivity and spectral resolution, which our spectra of VVV-WIT-13 lack.
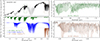 |
Fig. 5. Upper left: Near-infrared spectrum of VVV-WIT-13 taken during the brightness plateau. The best-fit molecular spectra (AlO, H2O, and CO) are presented in the lower left panel; the effective temperature and column density are labelled in the plot. The coloured squares mark the spectral regions presented in the right panels. The spectral regions among J, H, and K bandpasses are shown in grey, which are dominated by water absorption features. Right: Zoomed-in views of two regions with molecular absorption features, with radial velocity listed in the heliocentric frame. The theoretical wavelengths of 13CO absorption bandheads are shown as dashed grey lines. |
Molecular spectral features.
We examined the H I absorption lines by fitting Gaussian profiles (Pa β, Pa γ, and Br γ; see line profiles and properties in Figure 6). All lines have a similar RV to AlO and CO, ranging from −94 to −100 km/s, and the equivalent widths (EW) are 3.4, 2.6, and 1.1 Å, respectively. The Gaussian Full Width Half Maximum (FWHM) of the line profiles is broader than the Gaussian broadening of molecular bands and the spectral resolution (15 km/s). The Pa β absorption line has an EW of 3.4 Å, placing it at the higher end of values from FUors (see Connelley & Reipurth 2018). If we assume a distance of 2.0 ± 1.0 kpc, the kinematic velocity at the Galactic longitude of VVV-WIT-13 is between −37 km/s and −10 km/s (in LSR; Wenger et al. 2018). Hence, the molecular bands and H I lines are blue-shifted.
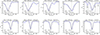 |
Fig. 6. Absorption lines observed during the outburst stage of VVV-WIT-13. We fit each line with a Gaussian profile (shown in black), with the central radial velocity marked by the dashed lines and noted above each sub-plot (heliocentric frame). Assuming a distance of 2 kpc, the VLSR is −22 km/s (or −15.2 km/s in the heliocentric frame). The measured EW and FWHM are labelled. In the sub-plot of DIB, the grey area is excluded from the Gaussian fitting. |
The broad He I absorption line is detected at 1.083 μm as another pronounced feature among FUors: a tracer of wind. However, the He I line does not have a significantly blue-shifted central radial velocity (3 km/s), which is inconsistent with other bona fide FUors. We also detected a group of metal lines, including Mg II, Fe I, Si I, and Al I. All of these metal lines have symmetric and narrow line profiles, with low RV, consistent with photospheric lines detected among FUors.
4.2. The fading spectrum
The two spectra in the 2023 and 2024 epochs have lower continuum flux than in the 2021 epoch as the Ks brightness was 3 mag fainter (Figure 7). We found that the CO absorption bands in the 2023 and 2024 epochs are shallower than in the 2021 epoch, with a lower column density (see Table 1). No AlO absorption was detected, indicating that the deep AlO absorption bands are temporary features associated with the eruptive event.
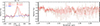 |
Fig. 7. Left: Profiles of the 2.12 μm H2 emission lines from the 2021, 2023, and 2024 epochs. Right: K bandpass, CO bandhead absorption features of the 2023 and 2024 spectra. |
We detected a blue-shifted H2 1 − 0 S(1) emission line at 2.12 μm, which is a common indicator of stellar wind or outflow in accreting YSOs (Greene & Lada 1996; Greene et al. 2010). This line is from an upper energy level 6956 K above the ground and, in principle, requires much higher excitation than CO or AlO observed in absorption. A similar emission line feature is not commonly seen among FUor-type eruptive YSOs, although it has been observed among EXors (e.g. Park et al. 2022) and a few peculiar eruptive YSOs (e.g. Kóspál et al. 2020). The combination of H2 emission and CO bandhead absorption features is only seen in a few cases, including the periodic variable EC 53, FUor-candidates without observed outbursts (e.g. CB 230 and IRAS 18270–0153W; Connelley & Reipurth 2018), and a rapidly faded eruptive YSO VVVv322 (ΔKs = 2.6 mag; Contreras Peña et al. 2017a,b). We fit simple Gaussian functions to the H2 line profiles of the 2023 and 2024 epochs, with measured RVs as −89 km/s and −68 km/s, FWHM as 156 km/s and 88 km/s, and equivalent widths as −53 Å and −30 Å. Such broad and variable H2 lines were previously observed on a few variable YSOs (e.g. VVVv815; Guo et al. 2020), tracing temporary features in the stellar wind and/or outflow. The RV of H2 lines are redder than molecular bands, which is uncommon on eruptive YSOs. Alternatively, it has been observed on a red nova (Steinmetz et al. 2025). Because absorption lines trace only material along the line of sight to the continuum source, the variations in the RV measured from molecular bands of the oxides trace small changes in the velocity field where these bands are excited. The H2 emission presumably arises from a larger volume of shocked gas, and thus is expected to be less blue-shifted if the overall velocity field is dominated by expansion.
In summary, VVV-WIT-13 exhibited unique spectral features in both the outburst and fading stages. During the outburst stage, it displayed deep absorption features including water vapour, AlO, and CO molecular bands, resembling a luminous cool accretion disk. H I lines are detected in absorption during the outburst stage, with similar RV to molecular bands. After the outburst, with the fading and cooling of the continuum emission, the AlO bands are no longer detected in the spectra, whilst the CO bandhead absorption still exists with a similar RV to the outburst stage. We observed broad and variable H2 emission associated with stellar wind. VVV-WIT-13 is the first high-amplitude eruptive source exhibiting H2 emission and CO absorption simultaneously. The 2023 and 2024 spectral features indicate a transitional phase between the eruptive and the quiescent stages.
5. Discussion
5.1. The outflow origin of molecular bands
Absorption and emission molecular bands of metal oxides are relatively rare in eruptive YSOs. Some notable examples are TiO and VO bands in emission in a few embedded Class I YSOs (Hillenbrand et al. 2012, 2013). While TiO and VO are common in late-type stellar atmospheres, photospheric and circumstellar AlO are rare. The gas phase of AlO has been detected in O-rich circumstellar envelopes, such as VY CMa (Tenenbaum & Ziurys 2009; Kamiński et al. 2013) and Miras (reviewed by Kamiński 2019). However, AlO is highly refractory, as it can quickly condense into solid dust grains, such as Al2O3. In chemical equilibrium at densities of a red supergiant wind or around a bloated star with a high mass accretion rate, the AlO molecule only forms efficiently at temperatures of 1100 K (with nH ∼ 104 cm−3). The presence of AlO indicates that it must have been preserved in the gas phase within a wind and/or shock environment, allowing it to survive below its expected formation temperature. Therefore, the chemical chain was disrupted by the rapid expansion of the gas, leading to the survival of the AlO molecule (McCabe et al. 1979; Tenenbaum & Ziurys 2009). Alternatively, sputtering in shocks or sublimation may also release AlO to the gas phase from solids.
As stated in Sect. 4, AlO bands were observed in the ejecta of stellar mergers, but deep AlO absorption has not been reported on young stars in the near-infrared, which raised our concern about the nature of VVV-WIT-13. At sub-millimetre wavelengths, the AlO emission was spatially resolved by ALMA around a high-mass young star, revealing that AlO is present at the base of the outflow (Tachibana et al. 2019). Here, we consider that both CO and AlO absorption bands arise from an expanding shell or wind from VVV-WIT-13. This is similar to what has been observed on V1057 Cyg, in which case the blue-shifted CO absorption bands are thought to originate from the ejecta of the eruptive YSO at the centre (Hartmann et al. 2004). It is also similar to the shell-expanding scene observed among red novae.
This outflow-formation scenario would explain the blue-shifted radial velocity of CO and AlO molecules against the Galactic rotational velocity and the metal absorption lines (see Figure 6). The strong outflow is commonly detected among eruptive variables, including FUors and red novae, which is traced by blue-shifted absorption lines (e.g. He I). Here we estimated the mass loss rate of VVV-WIT-13 based on the column density and the velocity of CO measured in this work (NCO = 3.5 × 1020 cm−2) and (VCO ∼ −100 km/s). We also assume that the wind is composed of 70% of hydrogen and 30% of helium (average atomic mass is 1.3), with a typical CO abundance (XCO = nCO/nH2 = 10−4). Therefore, the mass lost rate can be written as
 (1)
(1)
where μ = 1.3 and mH = 1.67 × 10⁻²⁷ kg. The covering fraction of the wind against a full solid angle is parametrised by η, which has a common value of 0.2 assuming an open angle of 40 deg. We assumed the CO wind is launched at rCO = 0.07 au from the star, by matching the escape velocity of 100 km/s around a 0.4 M⊙ young star. The mass loss rate is of the order of 10−5 M⊙ yr−1, comparable to the mass loss rate observed on FU Ori (Calvet et al. 1993). We note the mass accretion rate on FUors is normally of the order of 10−5 to 10−4 M⊙ yr−1. This mass loss rate is also comparable to the post-main-sequence AGB stars, which is between 10−6 and 10−4 M⊙ yr−1 (Höfner & Olofsson 2018). However, it is orders of magnitude smaller than the mass loss rate during the red novae stage (Tylenda et al. 2013; Blagorodnova et al. 2021).
5.2. Extinction measurements through spectral features
Diffuse interstellar bands (DIBs) are broad absorption bands, mainly contributed by organic compounds in the interstellar clouds (see e.g. Campbell et al. 2015). We found a DIB on the 2021 epoch spectrum of VVV-WIT-13 at 1.318 μm, but possibly blending with a nearby Si I line (Origlia et al. 2019). We fit the DIB with a Gaussian profile across wavelength ranges that avoid including contributions from metal lines (see the top right panel of Figure 6). We measured an EW of 1.3 Å and a RV of 5 km/s for this DIB. The RV of the λ1.3178 μm DIB absorption is redder than the H I lines, and molecular absorption bands and comparable to photospheric metal lines. Based on the empirical correlation between the DIB EW and the dust reddening derived by Hamano et al. (2016), we estimated E(B − V)≈2.9 mag, corresponding to an AV ∼ 9.0 mag assuming RV = 3.1. The choice of RV is an average of the Galactic diffuse interstellar medium, consistent with the extinction law we used for this work. This likely represents only the interstellar reddening component on the line of sight and does not include the local extinction from any circumstellar material surrounding VVV-WIT-13.
The ratio of the fluxes of the two H2 lines is another extinction indicator as the theoretical value is independent of the excitation conditions (1 − 0 Q(3)/S(1) = 0.7; Turner et al. 1977). According to the extinction curve from Wang & Chen (2019), we have AV = 130log10(fH2/0.7), where fH2 is the measured flux ratio of the two H2 lines. In our 2023 and 2024 spectra, due to the low signal-to-noise ratio beyond 2.42 μm (S/N = 5 and 2, respectively), we can only roughly estimate the extinction through this method. Using the spectrum taken in 2023, we measured fH2 = 0.95 ± 0.15, and therefore AV = 17.2 ± 8.3 mag. Although with a large uncertainty, this measured AV is consistent with the extinction measured on the colour-colour diagram during the quiescent stage, and it is larger than the 9 mag extinction estimated from DIB observed during the outburst. Here we cannot completely rule out the possibility that the circumstellar extinction has increased during the fading stage, due to the circumstellar dust pile-up again, whilst the disk is cooling down. We also suspect that the extinction measured from DIB is the interstellar extinction instead of the circumstellar extinction.
5.3. The Galactic location of VVV-WIT-13
Here we investigate the nature of VVV-WIT-13 by examining its Galactic location to obtain a more accurate distance modulus. We first test the hypothesis that VVV-WIT-13 shares the same distance as members from the SPICY YSO group G342.1+0.2. In Kuhn et al. (2021), groups of YSOs were identified through spatial clustering of YSOs using the HDBSCAN algorithm, which was originally applied to detect Galactic open clusters in Gaia DR2 (e.g. Kounkel & Covey 2019). However, the classification relied solely on 2D Galactic coordinates and did not incorporate distance or kinematic information. To address this limitation, we examined the proper motions (PMs) of both the SPICY group and VVV-WIT-13 using data from Gaia DR3 and the VVV survey’s VIRAC catalogue (the VIRAC2 version; Smith et al. 2025).
We cross-matched the coordinates of the G342.1+0.2 group members with the Gaia DR3 using a matching radius of 1″. A total of 83 SPICY group members have Gaia PM measurements. We then retrieved the VVV PMs of these sources from VIRAC (see the Appendix). For most sources, Gaia and VVV PMs differ by less than 2 mas/yr, with larger discrepancies occurring only for those with high uncertainties of the PM measurements (Figure 8). VVV-WIT-13 lies only ∼1 mas/yr from the projected centre of the SPICY group, suggesting a kinematic link to the group members. The ∼1 mas/yr threshold is commonly used for identifying open cluster members at 2 kpc (e.g. Borissova et al. 2018). Using VIRAC PMs, we estimated a PM-based distance of VVV-WIT-13 following the method of Guo et al. (2021), finding two likely ranges: 0.3–2 kpc or beyond 4 kpc (see the right panel of Figure 8). The close distance range is more reliable, as the Galactic rotational velocity is −80 km/s at 4–5 kpc, which is much larger than the RV observed on the photospheric lines and cannot be explained by non-circular motions.
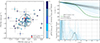 |
Fig. 8. Left: Gaia proper motions (PMs) of 83 group members of SPICY G342.1+0.2. The dashed ring marks the 1σ distribution of PMs from the centre of the group. The PMs of VVV-WIT-13 are obtained from the VIRAC2 catalogue of the VVV survey. The colour bar represents the difference between the PMs measured from Gaia and VVV. Right: PM distance of VVV-WIT-13 (black) and the 83 sources presented in the left panel. |
Given the complexity of establishing spatial and kinematic associations along the Galactic plane, we then assessed whether SPICY group G342.1+0.2 is truly dynamically bound. We searched Gaia DR3 sources located within 15′ of VVV-WIT-13 with G < 19 mag (5961 sources). The G-band brightness limit is set to eliminate sources with large PM and parallax (ϖ) uncertainties. We found that 37% of Gaia sources have PMs concentrated within the 1σ region shown in Figure 8. Among them, more than 1700 sources have ϖ > 0.33 mas/yr, corresponding to distances < 3 kpc. The number of Gaia sources sharing the same spatial and kinematic measurements as the SPICY group is an order of magnitude larger than the SPICY group itself. Therefore, we conclude that SPICY G342.1+0.2 is a loose YSO association rather than a bound cluster. Nevertheless, this does not affect our subsequent investigation of VVV-WIT-13’s Galactic location.
At l = 342°, the Galactic spiral arm model places the Sagittarius and Scutum–Centaurus arms at distances of 1 kpc and 3 kpc, respectively (Reid et al. 2019). Most retrieved Gaia sources, including SPICY YSOs, are thus likely located within or nearer than the Scutum–Centaurus arm, consistent with Gaia’s limited sensitivity to distant, embedded, and faint sources (G > 19 mag). Placing VVV-WIT-13 farther away (e.g. in the Norma arm or Galactic bulge) would imply interstellar extinction AV > 10 mag (see extinction maps; Soto et al. 2019; Zucker et al. 2025)4. The distance modulus at a 5 kpc distance is 13.5 mag, pushing VVV-WIT-13 into the intermediate-mass YSO regime (MK < 1 mag and mass > 1.5 M⊙), where such accretion bursts are extremely rare. We also note that VVV-WIT-13 is projected against a Galactic infrared dark cloud. Such clouds are the densest regions of molecular clouds, and the probability of a chance alignment in the VVV Galactic disk fields is only ∼1% (Section 4 in Lucas et al. 2020). In summary, the kinematic and location information support the classification of VVV-WIT-13 as a Galactic young star with a distance of less than 3 kpc.
Nevertheless, we explored the possibility that VVV-WIT-13 is a red nova. The progenitors of red novae are usually contact binaries or systems entering common-envelope evolution (e.g. V1309 Sco Kamiński et al. 2015). Those sources are not expected to have a significant mid-infrared excess, which does not fit the pre-outburst SED of VVV-WIT-13. Alternatively, some luminous red novae have progenitors that appear to be evolved massive stars, which could have previous ejecta or a dusty envelope corresponding to the mid-infrared excess (see examples in Blagorodnova et al. 2021). VVV-WIT-13 is clearly too faint to be a high-luminous event (e.g. 104 L⊙), unless located on the other side of the Galaxy (10 kpc) with a high extinction (e.g. AV > 30 mag). In this case, the proper motion of this source will be significantly different from the observed values (see the right panel of Fig. 8). However, VVV-WIT-13 can still be a low-luminosity red nova that happened on an embedded post-main-sequence star.
An interesting relation to red novae and luminous red novae is that VVV-WIT-13 displayed a short brightening event before the main eruption. The brightening event occurred at around day Δt = 1000, i.e. some 2000 days before the beginning of the main eruption (see Figure 2). In some red novae, this early short-lasting rise in brightness is also observed before the main outburst and is often referred to as the precursor (Addison et al. 2022). Its origin is not yet known, but it has been associated with the L2 mass loss and dynamical interaction between the two bodies, which eventually merge, producing the main red nova outburst (e.g. Pejcha et al. 2017; Metzger & Pejcha 2017) Although this is not the standard scenario now considered for red novae, some authors ascribe this phase of the merger to the tidal disruption of the secondary (e.g. a planet) whose shattered material is later accreted onto the primary, producing the main burst (O’Connor et al. 2023; Yarza et al. 2025).
5.4. A possible tidally disrupted planet embryo
In this work, we found some clues suggesting that the outburst on VVV-WIT-13 might be a disruption of a giant planet embryo around a young star. First, assuming Keplerian rotation around a 1 M⊙ star, the 1748 d pre-outburst variation timescale corresponds to a rKEP = 2.8 au orbit (or 1.8 au around a 0.5 M⊙ star), which may be interpreted as an asymmetric warm accretion disk. Second, it explains the high mid-infrared amplitude as the black-body emission from a warm disk (T = 850 K) peaks at 3.4 μm according to Wien’s displacement law. Third, the duration of the outburst is 2000–3000 days, comparable to the dynamic timescale at such a radius. This timescale is much longer than the timescale of EXor-type outbursts caused by instability at the innermost disk and the classical red nova (200 − 300 days). In this scenario, the warm disk ring does not reach the stellar surface, with an inner cavity. Therefore, it maintains an intermediate effective temperature, which explains the temperature estimated from molecular bands (see Sect. 4). This scenario predicts that the initial outburst occurs due to the dynamical rearrangement of the orbits of the disrupted material of a low-density planet embryo. During this time, the innermost disk regions do not flare as they are spatially distinct from the region where the disruption occurs. This flare thus has a very different disk structure: a hot ring in the disk versus a hot inner disk in FUors.
To test this theoretical scenario and compare with observations, we performed 2D hydrodynamic simulations using FARGO3D (Benítez-Llambay & Masset 2016). Additionally, our model includes a time-dependent energy equation under the adiabatic approximation. This allows us to compute the effective temperature of the disk and subsequently estimate the radiative flux from the surface. In summary, our ad hoc hydrodynamic model reproduces not only the amplitude of the outburst, but also the rise and decay timescales and the duration of the eruptive event (see Figure 9). Although our current attempts are only based on ad hoc models, our results indicate that a tidally disrupted 5MJ mass planet embryo is a possible explanation for the outburst observed on VVV-WIT-13. If correct, this would represent the first direct observational evidence of such a phenomenon, offering a unique window into the early dynamical evolution of massive clumps in protoplanetary disks (Nayakshin 2010; Cha & Nayakshin 2011). However, we acknowledge some drawbacks of this model. For example, the formation and migration history of the embryo is not thoroughly discussed, which therefore affects the plausibility of this scenario. The detailed methods of the simulation, more sophisticated exploration of the parameter space, and careful calculations on radiative transfer will be presented in a separate publication (Montesinos et al. in prep.).
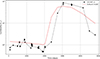 |
Fig. 9. Time evolution of the bolometric luminosity of the system. The black curve (dotted line) shows the observational data from VVV-WIT-13 (converted to bolometric), while the red curve (solid line) corresponds to our hydrodynamic model. The time axis of the model has been shifted to align the luminosity peaks. The agreement between the rise and decay timescales suggests that the observed outburst is consistent with the tidal disruption of a giant 5MJ mass planet embryo. |
6. Summary
In this work, we present photometric and spectroscopic analyses of an infrared eruptive source: VVV-WIT-13. We estimated the distance of VVV-WIT-13 as 2 kpc, considering it is a member of the SPICY YSO group G342.1+0.2. Initially, this target was classified as an eruptive YSO based on its photometric characteristics and pre-outburst infrared SED studies (SPICY Kuhn et al. 2021). An outburst is observed on VVV-WIT-13 starting from the second half of the year 2016, with amplitudes ΔKs = 4.5 mag, ΔW1 = 3.9 mag and ΔW2 = 3.0 mag. The rising stage of the outburst is only captured by one or two epochs in the infrared photometry, with a duration of less than 1 year.
Three sets of spectra were observed during the event, with many absorption features, including H I, CO, H2O, and AlO absorption bands. The CO and AlO bands have RV around −100 km/s, significantly bluer than photospheric lines (e.g. Si I and Al I at 0 km/s). We suspect that the temporary AlO bands observed during the outburst were formed within the stellar wind–outflow, and thus the AlO molecules are preserved from condensing into the dust form. The AlO absorption bands have never been recorded on an outbursting YSO, and they were previously seen among red novae. The true nature of VVV-WIT-13 is still unclear, and hence the name ‘What is this?’.
We found the following evidence that indicates VVV-WIT-13 is an outbursting young star:
-
VVV-WIT-13 is projected in a Galactic star-forming region with several Galactic molecular clouds, Herschel Hi-Gal clumps and H II regions within 5′ radius. It is located within or behind an infrared dark cloud, G342.135+0.204.
-
We studied the spatial and dynamical association of VVV-WIT-13 and discovered that the VVV VIRAC proper motions of VVV-WIT-13 are consistent with a distance between 0.3 to 2 kpc. The radial velocity of VVV-WIT-13, measured from photospheric lines, supports this distance estimation rather than a farther Galactic location.
-
During the quiescent stage, VVV-WIT-13 had infrared colours consistent with an embedded YSO. Using the empirical colours of YSOs, we estimated a pre-outburst line-of-sight extinction AV = 17 mag, and a bolometric luminosity of 0.9 L⊙. According to pre-main-sequence evolutionary models, VVV-WIT-13 is a low-mass YSO (M = 0.4 − 0.6 M⊙). Some low-amplitude variations are observed on the pre-outburst light curves, with a possible 1748-day period, which might be linked to an asymmetric circumstellar disk.
-
The duration of the outburst observed on VVV-WIT-13 is ∼2000 days, which is intermediate between the year-long EXor-type outbursts and the decades-long FUor-type outbursts. This places VVV-WIT-13 among the new category of infrared observed multi-year-long outbursts (reviewed by Fischer et al. 2023). The full-event timescale of VVV-WIT-13 significantly exceeds that of most luminous red novae, which are typically shorter than 1000 days.
-
Using the CO bandhead absorption feature, we estimated the mass loss rate during the outburst is of the order of 10−5 M⊙ yrxs, which is comparable to FU Ori, but much smaller than stellar merger events.
The fading stage of VVV-WIT-13 started after 2021, and the Ks-band brightness rapidly dropped below 14 mag in two years. Two spectra taken during the fading stage no longer have AlO absorption features, but with broad H2 emission lines. The CO bandhead absorption feature is also shallower than during the outburst stage.
We proposed one possible theoretical solution to the outburst observed on VVV-WIT-13 as a tidally disrupted planetary embryo. Our ad hoc model can recreate the observed outburst. A forthcoming paper will explore the parameter space and detailed theoretical models. We note that there are still many unknown facts about this source, and the disruption of a planetary embryo is only one theoretical solution.
In a recent spectroscopic observation, the CO bandheads beyond 2.3 μm turned from absorption into emission features, suggesting the existence of hot CO gas near the central star. Common indicators of magnetospheric accretion, such as Brγ and Na I doublets, are detected, which further confirms the young nature of this source. The mystery about VVV-WIT-13 continues, and the most recent inner disk evolution and theoretical simulations will be presented in a forthcoming publication. In addition, observations at long wavelengths would help to define other important parameters of this source, such as disk inclination angle, the disk mass, and the existence of sub-structures in the circumstellar disk.
Data availability
Full Table A.1 is available at the CDS via https://cdsarc.cds.unistra.fr/viz-bin/cat/J/A+A/703/A141
YSOs have IRAC2 > 7.8 mag and IRAC4 – [24.0] ≥ 2.5 mag.
This estimation of AV does not include the extinction caused by the infrared dark cloud 342.135+0.204, due to the width of the cloud is narrower than the resolution of the extinction map.
Acknowledgments
We thank the constructive comments from the anonymous referee. We gratefully thank the helpful comments from Prof. Gregory Herczeg. This work is supported by the China-Chile Joint Research Fund (CCJRF No.2301) and the Chinese Academy of Sciences South America Center for Astronomy (CASSACA) Key Research Project E52H540301. CCJRF is provided by the CASSACA and established by the National Astronomical Observatories, Chinese Academy of Sciences (NAOC) and Chilean Astronomy Society (SOCHIAS) to support China-Chile collaborations in astronomy. ZG, RK, JB and JO are funded by ANID, Millennium Science Initiative, AIM23-001. ZG and CM are funded by the project ALMA-ANID 31240014. MM acknowledges financial support from FONDECYT Regular 1241818. JB and RK thank the support from FONDECYT Regular project No. 1240249. R.K.S. acknowledges support from CNPq/Brazil through projects 308298/2022-5 and 421034/2023-8. A.C.G. acknowledges support from PRIN-MUR 2022 20228JPA3A “The path to star and planet formation in the JWST era (PATH)” funded by NextGeneration EU and by INAF-GoG 2022 “NIR-dark Accretion Outbursts in Massive Young stellar objects (NAOMY)” and Large Grant INAF 2022 “YSOs Outflows, Disks and Accretion: towards a global framework for the evolution of planet forming systems (YODA)”. VE acknowledges support from the Ministry of Science and Higher Education of the Russian Federation (State assignment in the field of scientific activity 2023, GZ0110/23-10-IF). LZW and LXY are supported by the Chinese Academy of Sciences South America Center for Astronomy (CASSACA) Key Research Project E52H540301, and in part by the Chinese Academy of Sciences (CAS) through a grant to the CASSACA. C.C.P. was supported by the National Research Foundation of Korea (NRF) grant funded by the Korean government (MEST; No. 2019R1A6A1A10073437)” This publication makes use of data products from the Near-Earth Object Wide-field Infrared Survey Explorer (NEOWISE), which is a joint project of the Jet Propulsion Laboratory/California Institute of Technology and the University of Arizona. NEOWISE is funded by the National Aeronautics and Space Administration. This research has made use of the NASA/IPAC Infrared Science Archive, which is funded by the National Aeronautics and Space Administration and operated by the California Institute of Technology. This work has made use of the University of Hertfordshire’s high-performance computing facility (http://uhhpc.herts.ac.uk). This research has made use of the SVO Filter Profile Service “Carlos Rodrigo”, funded by MCIN/AEI/10.13039/501100011033/ through grant PID2020-112949GB-I00. The authors acknowledge the use of artificial intelligence language models (ChatGPT, Deepseek and Grammarly) for assistance with text editing.
References
- Ábrahám, P., Juhász, A., Dullemond, C. P., et al. 2009, Nature, 459, 224 [Google Scholar]
- Addison, H., Blagorodnova, N., Groot, P. J., et al. 2022, MNRAS, 517, 1884 [NASA ADS] [CrossRef] [Google Scholar]
- Armitage, P. J., Livio, M., & Pringle, J. E. 2001, MNRAS, 324, 705 [NASA ADS] [CrossRef] [Google Scholar]
- Banerjee, D. P. K., Varricatt, W. P., Mathew, B., Launila, O., & Ashok, N. M. 2012, ApJ, 753, L20 [Google Scholar]
- Baraffe, I., Homeier, D., Allard, F., & Chabrier, G. 2015, A&A, 577, A42 [NASA ADS] [CrossRef] [EDP Sciences] [Google Scholar]
- Bell, K. R. 1999, ApJ, 526, 411 [Google Scholar]
- Benítez-Llambay, P., & Masset, F. S. 2016, ApJS, 223, 11 [Google Scholar]
- Benjamin, R. A., Churchwell, E., Babler, B. L., et al. 2003, PASP, 115, 953 [Google Scholar]
- Blagorodnova, N., Klencki, J., Pejcha, O., et al. 2021, A&A, 653, A134 [NASA ADS] [CrossRef] [EDP Sciences] [Google Scholar]
- Bond, H. E., Henden, A., Levay, Z. G., et al. 2003, Nature, 422, 405 [CrossRef] [Google Scholar]
- Borchert, E. M. A., Price, D. J., Pinte, C., & Cuello, N. 2022, MNRAS, 510, L37 [Google Scholar]
- Borissova, J., Ivanov, V. D., Lucas, P. W., et al. 2018, MNRAS, 481, 3902 [NASA ADS] [CrossRef] [Google Scholar]
- Bowesman, C. A., Shuai, M., Yurchenko, S. N., & Tennyson, J. 2021, MNRAS, 508, 3181 [NASA ADS] [CrossRef] [Google Scholar]
- Briceño, C., Vivas, A. K., Hernández, J., et al. 2004, ApJ, 606, L123 [Google Scholar]
- Calvet, N., Hartmann, L., & Kenyon, S. J. 1993, ApJ, 402, 623 [Google Scholar]
- Campbell, E. K., Holz, M., Gerlich, D., & Maier, J. P. 2015, Nature, 523, 322 [NASA ADS] [CrossRef] [Google Scholar]
- Carey, S. J., Noriega-Crespo, A., Mizuno, D. R., et al. 2009, PASP, 121, 76 [Google Scholar]
- Cha, S.-H., & Nayakshin, S. 2011, MNRAS, 415, 3319 [Google Scholar]
- Connelley, M. S., & Reipurth, B. 2018, ApJ, 861, 145 [NASA ADS] [CrossRef] [Google Scholar]
- Contreras Peña, C., Lucas, P. W., Minniti, D., et al. 2017a, MNRAS, 465, 3011 [Google Scholar]
- Contreras Peña, C., Lucas, P. W., Kurtev, R., et al. 2017b, MNRAS, 465, 3039 [Google Scholar]
- Contreras Peña, C., Lucas, P. W., Guo, Z., & Smith, L. 2024, MNRAS, 528, 1823 [Google Scholar]
- Cuello, N., Dipierro, G., Mentiplay, D., et al. 2019, MNRAS, 483, 4114 [Google Scholar]
- De, K., MacLeod, M., Karambelkar, V., et al. 2023, Nature, 617, 55 [NASA ADS] [CrossRef] [Google Scholar]
- Duarte-Cabral, A., Colombo, D., Urquhart, J. S., et al. 2021, MNRAS, 500, 3027 [Google Scholar]
- Elbakyan, V. G., Nayakshin, S., Vorobyov, E. I., Caratti o Garatti, A., & Eislöffel, J., 2021, A&A, 651, L3 [NASA ADS] [CrossRef] [EDP Sciences] [Google Scholar]
- Elia, D., Molinari, S., Schisano, E., et al. 2017, MNRAS, 471, 100 [NASA ADS] [CrossRef] [Google Scholar]
- Elia, D., Merello, M., Molinari, S., et al. 2021, MNRAS, 504, 2742 [NASA ADS] [CrossRef] [Google Scholar]
- Fischer, W. J., Hillenbrand, L. A., Herczeg, G. J., et al. 2023, in Protostars and Planets VII, eds. S. Inutsuka, Y. Aikawa, T. Muto, K. Tomida, & M. Tamura, ASP Conf. Ser., 534, 355 [NASA ADS] [Google Scholar]
- Freudling, W., Romaniello, M., Bramich, D. M., et al. 2013, A&A, 559, A96 [NASA ADS] [CrossRef] [EDP Sciences] [Google Scholar]
- Gagne, J., Lambrides, E., Faherty, J. K., & Simcoe, R. 2015, https://doi.org/10.5281/zenodo.18775 [Google Scholar]
- Gaia Collaboration (Vallenari, A., et al.) 2023, A&A, 674, A1 [NASA ADS] [CrossRef] [EDP Sciences] [Google Scholar]
- Greene, T. P., & Lada, C. J. 1996, AJ, 112, 2184 [Google Scholar]
- Greene, T. P., Barsony, M., & Weintraub, D. A. 2010, ApJ, 725, 1100 [NASA ADS] [CrossRef] [Google Scholar]
- Guo, Z., Herczeg, G. J., Jose, J., et al. 2018, ApJ, 852, 56 [Google Scholar]
- Guo, Z., Lucas, P. W., Contreras Peña, C., et al. 2020, MNRAS, 492, 294 [NASA ADS] [CrossRef] [Google Scholar]
- Guo, Z., Lucas, P. W., Contreras Peña, C., et al. 2021, MNRAS, 504, 830 [NASA ADS] [CrossRef] [Google Scholar]
- Guo, Z., Lucas, P. W., Smith, L. C., et al. 2022, MNRAS, 513, 1015 [Google Scholar]
- Guo, Z., Lucas, P. W., Kurtev, R., et al. 2024a, MNRAS, 528, 1769 [NASA ADS] [CrossRef] [Google Scholar]
- Guo, Z., Lucas, P. W., Kurtev, R. G., et al. 2024b, MNRAS, 529, L115 [Google Scholar]
- Hamano, S., Kobayashi, N., Kondo, S., et al. 2016, ApJ, 821, 42 [Google Scholar]
- Hartmann, L., Hinkle, K., & Calvet, N. 2004, ApJ, 609, 906 [NASA ADS] [CrossRef] [Google Scholar]
- Hillenbrand, L. A., Knapp, G. R., Padgett, D. L., Rebull, L. M., & McGehee, P. M. 2012, AJ, 143, 37 [NASA ADS] [CrossRef] [Google Scholar]
- Hillenbrand, L. A., Miller, A. A., Covey, K. R., et al. 2013, AJ, 145, 59 [NASA ADS] [CrossRef] [Google Scholar]
- Höfner, S., & Olofsson, H. 2018, A&ARv, 26, 1 [Google Scholar]
- Jørgensen, J. K., Belloche, A., & Garrod, R. T. 2020, ARA&A, 58, 727 [Google Scholar]
- Kamiński, T. 2019, in Why Galaxies Care About AGB Stars: A Continuing Challenge through Cosmic Time, eds. F. Kerschbaum, M. Groenewegen, & H. Olofsson, IAU Symp., 343, 108 [Google Scholar]
- Kaminski, T. 2024, ArXiv e-prints [arXiv:2401.03919] [Google Scholar]
- Kamiński, T., Schmidt, M. R., & Menten, K. M. 2013, A&A, 549, A6 [Google Scholar]
- Kamiński, T., Mason, E., Tylenda, R., & Schmidt, M. R. 2015, A&A, 580, A34 [NASA ADS] [CrossRef] [EDP Sciences] [Google Scholar]
- Kamiński, T., Steffen, W., Tylenda, R., et al. 2018, A&A, 617, A129 [NASA ADS] [CrossRef] [EDP Sciences] [Google Scholar]
- Kato, D., Nagashima, C., Nagayama, T., et al. 2007, PASJ, 59, 615 [NASA ADS] [Google Scholar]
- Kausch, W., Noll, S., Smette, A., et al. 2015, A&A, 576, A78 [NASA ADS] [CrossRef] [EDP Sciences] [Google Scholar]
- Kóspál, Á., Szabó, Z. M., Ábrahám, P., et al. 2020, ApJ, 889, 148 [CrossRef] [Google Scholar]
- Kounkel, M., & Covey, K. 2019, AJ, 158, 122 [Google Scholar]
- Kuhn, M. A., de Souza, R. S., Krone-Martins, A., et al. 2021, ApJS, 254, 33 [NASA ADS] [CrossRef] [Google Scholar]
- Lada, C. J. 1987, in Star Forming Regions, eds. M. Peimbert, & J. Jugaku, IAU Symp., 115, 1 [NASA ADS] [Google Scholar]
- Lang, D. 2014, AJ, 147, 108 [Google Scholar]
- Liu, H., Herczeg, G. J., Johnstone, D., et al. 2022, ApJ, 936, 152 [NASA ADS] [CrossRef] [Google Scholar]
- Lodato, G., & Clarke, C. J. 2004, MNRAS, 353, 841 [NASA ADS] [CrossRef] [Google Scholar]
- Lucas, P. W., Smith, L. C., Contreras Peña, C., et al. 2017, MNRAS, 472, 2990 [Google Scholar]
- Lucas, P. W., Minniti, D., Kamble, A., et al. 2020, MNRAS, 492, 4847 [Google Scholar]
- Lucas, P. W., Smith, L. C., Guo, Z., et al. 2024, MNRAS, 528, 1789 [NASA ADS] [CrossRef] [Google Scholar]
- Mainzer, A., Bauer, J., Cutri, R. M., et al. 2014, ApJ, 792, 30 [Google Scholar]
- McCabe, E. M., Smith, R. C., & Clegg, R. E. S. 1979, Nature, 281, 263 [Google Scholar]
- Mège, P., Russeil, D., Zavagno, A., et al. 2021, A&A, 646, A74 [NASA ADS] [CrossRef] [EDP Sciences] [Google Scholar]
- Meisner, A. M., Lang, D., & Schlegel, D. J. 2017, AJ, 153, 38 [Google Scholar]
- Metzger, B. D., & Pejcha, O. 2017, MNRAS, 471, 3200 [NASA ADS] [CrossRef] [Google Scholar]
- Meyer, M. R., Calvet, N., & Hillenbrand, L. A. 1997, AJ, 114, 288 [Google Scholar]
- Minniti, D. 2016, Galactic Surveys: New Results on Formation, Evolution, Structure and Chemical Evolution of the Milky Way, 10 [Google Scholar]
- Minniti, D., Lucas, P. W., Emerson, J. P., et al. 2010, New Astron., 15, 433 [Google Scholar]
- Minniti, D., Saito, R. K., Forster, F., et al. 2017, ApJ, 849, L23 [CrossRef] [Google Scholar]
- Moorwood, A., Cuby, J. G., & Lidman, C. 1998, Messenger, 91, 9 [NASA ADS] [Google Scholar]
- Morris, C., Guo, Z., Lucas, P. W., et al. 2025, MNRAS, 537, 2763 [Google Scholar]
- Nayakshin, S. 2010, MNRAS, 408, L36 [NASA ADS] [CrossRef] [Google Scholar]
- Nayakshin, S., & Elbakyan, V. 2024, MNRAS, 528, 2182 [Google Scholar]
- Nayakshin, S., Cruz Sáenz de Miera, F., Kóspál, Á., et al. 2024, MNRAS, 530, 1749 [NASA ADS] [CrossRef] [Google Scholar]
- O’Connor, C. E., Bildsten, L., Cantiello, M., & Lai, D. 2023, ApJ, 950, 128 [CrossRef] [Google Scholar]
- Origlia, L., Dalessandro, E., Sanna, N., et al. 2019, A&A, 629, A117 [NASA ADS] [CrossRef] [EDP Sciences] [Google Scholar]
- Park, S., Kóspál, Á., Ábrahám, P., et al. 2022, ApJ, 941, 165 [NASA ADS] [CrossRef] [Google Scholar]
- Pastorello, A., Mason, E., Taubenberger, S., et al. 2019, A&A, 630, A75 [NASA ADS] [CrossRef] [EDP Sciences] [Google Scholar]
- Patrascu, A. T., Yurchenko, S. N., & Tennyson, J. 2015, MNRAS, 449, 3613 [NASA ADS] [CrossRef] [Google Scholar]
- Pejcha, O., Metzger, B. D., Tyles, J. G., & Tomida, K. 2017, ApJ, 850, 59 [NASA ADS] [CrossRef] [Google Scholar]
- Peretto, N., & Fuller, G. A. 2009, A&A, 505, 405 [NASA ADS] [CrossRef] [EDP Sciences] [Google Scholar]
- Peretto, N., Lenfestey, C., Fuller, G. A., et al. 2016, A&A, 590, A72 [NASA ADS] [CrossRef] [EDP Sciences] [Google Scholar]
- Poggiani, R. 2024, The Golden Age of Cataclysmic Variables and Related Objects– VI, 34 [Google Scholar]
- Rees, M. J. 1988, Nature, 333, 523 [Google Scholar]
- Reid, M. J., Menten, K. M., Brunthaler, A., et al. 2019, ApJ, 885, 131 [Google Scholar]
- Robitaille, T. P., Meade, M. R., Babler, B. L., et al. 2008, AJ, 136, 2413 [NASA ADS] [CrossRef] [Google Scholar]
- Rodrigo, C., Solano, E., & Bayo, A. 2012, IVOA Working Draft 15 October 2012 [Google Scholar]
- Saito, R. K., Stecklum, B., Minniti, D., et al. 2023, ApJ, 958, L1 [NASA ADS] [CrossRef] [Google Scholar]
- Saito, R. K., Hempel, M., Alonso-García, J., et al. 2024, A&A, 689, A148 [NASA ADS] [CrossRef] [EDP Sciences] [Google Scholar]
- Scaringi, S., Maccarone, T. J., Kording, E., et al. 2015, Sci. Adv., 1, e1500686 [NASA ADS] [CrossRef] [Google Scholar]
- Simcoe, R. A., Burgasser, A. J., Schechter, P. L., et al. 2013, PASP, 125, 270 [NASA ADS] [CrossRef] [Google Scholar]
- Skrutskie, M. F., Cutri, R. M., Stiening, R., et al. 2006, AJ, 131, 1163 [NASA ADS] [CrossRef] [Google Scholar]
- Smette, A., Sana, H., Noll, S., et al. 2015, A&A, 576, A77 [NASA ADS] [CrossRef] [EDP Sciences] [Google Scholar]
- Smith, L. C., Koposov, S. E., Lucas, P. W., et al. 2021, MNRAS, 505, 1992 [NASA ADS] [CrossRef] [Google Scholar]
- Smith, L. C., Lucas, P. W., Koposov, S. E., et al. 2025, MNRAS, 536, 3707 [NASA ADS] [CrossRef] [Google Scholar]
- Soker, N. 2023, MNRAS, 524, L94 [NASA ADS] [CrossRef] [Google Scholar]
- Soker, N., & Tylenda, R. 2006, MNRAS, 373, 733 [NASA ADS] [CrossRef] [Google Scholar]
- Soto, M., Barbá, R., Minniti, D., et al. 2019, MNRAS, 488, 2650 [Google Scholar]
- Steinmetz, T., Kamiński, T., Schmidt, M., & Kiljan, A. 2024, A&A, 682, A127 [NASA ADS] [CrossRef] [EDP Sciences] [Google Scholar]
- Steinmetz, T., Kamiński, T., Melis, C., et al. 2025, A&A, 699, A316 [NASA ADS] [CrossRef] [EDP Sciences] [Google Scholar]
- Stephan, A. P., Naoz, S., Gaudi, B. S., & Salas, J. M. 2020, ApJ, 889, 45 [NASA ADS] [CrossRef] [Google Scholar]
- Tachibana, S., Kamizuka, T., Hirota, T., et al. 2019, ApJ, 875, L29 [NASA ADS] [CrossRef] [Google Scholar]
- Tenenbaum, E. D., & Ziurys, L. M. 2009, ApJ, 694, L59 [NASA ADS] [CrossRef] [Google Scholar]
- Tennyson, J., Yurchenko, S. N., Al-Refaie, A. F., et al. 2016, J. Mol. Spectrosc., 327, 73, New Visions of Spectroscopic Databases, Volume II [Google Scholar]
- Turner, J., Kirby-Docken, K., & Dalgarno, A. 1977, ApJS, 35, 281 [NASA ADS] [CrossRef] [Google Scholar]
- Tylenda, R., Hajduk, M., Kamiński, T., et al. 2011, A&A, 528, A114 [NASA ADS] [CrossRef] [EDP Sciences] [Google Scholar]
- Tylenda, R., Kamiński, T., Udalski, A., et al. 2013, A&A, 555, A16 [NASA ADS] [CrossRef] [EDP Sciences] [Google Scholar]
- Vernet, J., Dekker, H., D’Odorico, S., et al. 2011, A&A, 536, A105 [NASA ADS] [CrossRef] [EDP Sciences] [Google Scholar]
- Wang, S., & Chen, X. 2019, ApJ, 877, 116 [Google Scholar]
- Wenger, T. V., Balser, D. S., Anderson, L. D., & Bania, T. M. 2018, ApJ, 856, 52 [Google Scholar]
- Wright, E. L., Eisenhardt, P. R. M., Mainzer, A. K., et al. 2010, AJ, 140, 1868 [Google Scholar]
- Yan, Y. T., Henkel, C., Kobayashi, C., et al. 2023, A&A, 670, A98 [NASA ADS] [CrossRef] [EDP Sciences] [Google Scholar]
- Yarza, R., MacLeod, M., Idini, B., Murray-Clay, R., & Ramirez-Ruiz, E. 2025, ApJ, submitted [arXiv:2507.05365] [Google Scholar]
- Zechmeister, M., & Kürster, M. 2009, A&A, 496, 577 [CrossRef] [EDP Sciences] [Google Scholar]
- Zhu, Z., Hartmann, L., Calvet, N., et al. 2007, ApJ, 669, 483 [NASA ADS] [CrossRef] [Google Scholar]
- Zhu, Z., Hartmann, L., & Gammie, C. 2009, ApJ, 694, 1045 [Google Scholar]
- Zucker, C., Saydjari, A. K., Speagle, J. S., et al. 2025, ApJ, 992, 39 [Google Scholar]
Appendix A: Photometric measurements
Here we present a table containing photometric measurements of VVV-WIT-13. A full version of the table (machine-readable format) is attached as a supplementary file.
Photometric data
Appendix B: VIRAC photometry and PM of SPICY group G342.1+0.2
Here we present the near- and mid-infrared variability of 442 YSO candidates in the SPICY group G342.1+0.2 by cross-matching the SPICY catalogue with VVV and NEOWISE time series. Overall, 422 sources have counterparts (distance less than 1 arcsec) in the VIRAC2 catalogue, and 220 sources have counterparts in the NEOWISE catalogue. The distribution of the Ks-band amplitude is presented in Figure B.1, with 16% of the sources having ΔKs > 1 mag and 6.6% with ΔKs > 2 mag. Moreover, 19 out of 220 sources have ΔW1 and ΔW2 greater than 1 mag (see Figure B.1 for statistical plots).
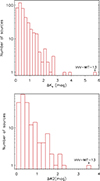 |
Fig. B.1. Histograms of Ks and W2 amplitude of the members of SPICY group G342.1+0.2. |
We identified four objects that have eruptive light curve morphologies, including VVV-WIT-13. The light curves of the other three objects, SPICY 42942, SPICY 43289 and SPICY 43680 are presented in the left panels of Figure B.3. Specifically, SPICY 42942 is classified as a Class II YSO in the SPICY catalogue, with ΔKS = 3.56 mag and ΔW2 = 0.83 mag. Although its overall light curve morphology has an eruptive shape, there was a detection around MJD 55450 with Ks = 14.15 mag, which leads to confusion on the true variable nature of this source. We also checked the 2MASS Ks-band image Skrutskie et al. (2006) of SPICY 42942, and it was not seen on the image, indicating that it was fainter than 15.0 mag in Ks. Therefore, we still list it as a candidate eruptive YSO instead of a dipper.audiences will know what a dipper is SPICY 43289 exhibits typical eruptive light curves with ΔKs = 3.84 mag and ΔW2 = 1.71 mag. The outburst lasted about 2500 to 3000 days based on the NEOWISE light curves. SPICY 43680 had a low-amplitude outburst with ΔKs = 0.85 mag and ΔW2 = 1.11 mag. The duration of this event is on the scale of 1500 days.
Eight sources exhibit long-term periodic variations that resemble mira-type variables (see Figure B.3). The periods of these sources were extracted by a modified Lomb-Scargle method, which fits the light curve with a sinusoidal function plus a linear variation trend (see Guo et al. 2022, for more information). All eight variables have ΔKs between 1 and 3 mag, which is 12% of all group members within that amplitude range. The contamination should be noted when using the SPICY catalogue to identify YSOs.
We obtained colour indices of the 219 YSO candidates from the SPICY group G342.1+0.2, with available detections in the ALLWISE catalogue. The W1 − W2 and W3 − W4 colour-colour diagram is presented in Figure B.2. The lower right region was drawn by Guo et al. (2022), which is populated by mira-type variables. In the SPICY group G342.1+0.2, 14 sources with 1 < ΔKs < 3 mag are located in the region of Miras, including the 8 Miras identified by their light curve morphologies.
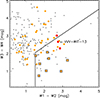 |
Fig. B.2. ALLWISE colour-colour diagram of sources from SPICY group G342.1+0.2. Data points are colour-coded by their VVV Ks amplitude, as ΔKs < 1 (grey), 1 ≤ ΔKs < 3 (orange), and ΔKs ≥ 3 (red). Mira candidates are marked by squares. The solid lines are boundaries between regions more populated with YSOs (upper left) and Miras (bottom right). |
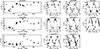 |
Fig. B.3. Left: VVV light curves of three eruptive YSO candidates in the SPICY group G342.1+0.2. The name of each source is shown above each plot. Right: Phase-folded VVV light curves of Mira candidates in the SPICY group G342.1+0.2, with periods presented on the x-axis. |
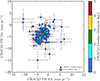 |
Fig. B4. Proper motions of SPICY group G342.1+0.2 from VIRAC2β catalogue. VVV-WIT-13 is presented as the white star. The VIRAC parallax of this group is shown as the colour bar. |
We present the VIRAC PMs of the SPICY group G342.1+0.2. We found a median centre location at -1.3 and -2.8 mas/yr. The 1σ spread of the PMs is 2.35 mas/yr on the 2D map. Notably, this spread is much larger than a typical young open cluster, suggesting SPICY group G342.1+0.2 is only a loose collection of stars instead of a dynamically bound group. The VIRAC parallax of VVV-WIT-13 has a large error bar ϖ = 2.1 ± 1.9 mas/yr. Therefore, we did not use it to calculate the distance. In fact, most VIRAC parallaxes have similar large error bars.
Appendix C: TiO band in the optical spectrum
The optical spectrum of VVV-WIT-13 was observed by XSHOOTER in the 2021 epoch. However, due to the high line-of-sight extinction, we only detected signals above 8000 Å. Here we present the spectrum in Figure C1. Even with a low signal-to-noise ratio (S/N ∼ 4), we detected a TiO absorption band of the ϵ system near 8400 Å. The bandhead of the δ system is also marked around 8800 Å, but is not detected. We also present a rough fitting result using the spectral model from ExoMol, with a 1300 K temperature and RV = 20 km/s. We note that due to the low S/N of the optical spectrum, we did not make analyses based on this result. However, we can confirm the existence of the TiO absorption band.
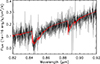 |
Fig. C1. Optical spectrum from XSHOOTER, taken in the 2021 epoch. A TiO model with T = 1300 K is presented in red. |
All Tables
All Figures
|
Fig. 1. Infrared images of the surrounding environment of VVV-WIT-13 (located in the centre and marked by the green circle in all frames). Left:Spitzer IRAC three-colour image (1 × 1 deg, blue: [4.5], green: [5.8], red: [8.0]), taken in 2004 during the pre-outburst stage, with Galactic longitude (l) and latitude (b). Sources belonging to the G342.1+0.2 YSO group, selected by SPICY, are marked by magenta circles. Upper right: Zoomed-in 5′ × 5′ Spitzer IRAC three-colour image, with the equatorial north-up orientation. Middle and bottom right: 1.2′ × 1.2′ W2-band images from unWISE (Lang 2014; Meisner et al. 2017), taken in 2017 and 2020. |
| In the text | |
|
Fig. 2. Left: Infrared light curves (Ks-, W1-, and W2-band) of VVV-WIT-13. The W1-band error bars (orange) are the standard deviation of the magnitude spread in each epoch before binning. The typical error bar in the Ks-band (< 0.1 mag) is smaller than the symbol size. A sinusoidal fitting result is presented by the grey line. The spectroscopic epochs are marked by the vertical dashed lines with the same colour scheme as in the right panels. Right: Near-infrared spectra of VVV-WIT-13 obtained in 2021, 2023, and 2024. The key spectral features are labelled on the plot. |
| In the text | |
|
Fig. 3. Near-infrared colour-colour diagram of YSOs from the VVV survey. VVV-WIT-13 is marked by the black circles (filled: quiescent; open: outburst). Other members in the SPICY group G342.1+0.2 are presented by the grey dots. A selection of VVV FUor-type eruptive sources are shown in red. The dashed line represents the synthetic locus of Class II YSOs (Meyer et al. 1997). The dotted and solid lines are extinction vectors from Wang & Chen (2019). |
| In the text | |
|
Fig. 4. Left: Spectral energy distribution (SED) of VVV-WIT-13 with data obtained from VVV, SOFI, Spitzer, WISE, and integrated spectra. The pre-outburst SED is shown as dots, and the in-outburst SED is shown as squares. Right: In-outburst SED of VVV-WIT-13 dereddened with AV ranging from 0 to 17 mag. As a comparison, we present the high-mass accretion SED calculated by Bell (1999). We scaled the model to match the SED of VVV-WIT-13, as presented by the dashed line. Error bars smaller than the size of the symbols are not presented. |
| In the text | |
|
Fig. 5. Upper left: Near-infrared spectrum of VVV-WIT-13 taken during the brightness plateau. The best-fit molecular spectra (AlO, H2O, and CO) are presented in the lower left panel; the effective temperature and column density are labelled in the plot. The coloured squares mark the spectral regions presented in the right panels. The spectral regions among J, H, and K bandpasses are shown in grey, which are dominated by water absorption features. Right: Zoomed-in views of two regions with molecular absorption features, with radial velocity listed in the heliocentric frame. The theoretical wavelengths of 13CO absorption bandheads are shown as dashed grey lines. |
| In the text | |
|
Fig. 6. Absorption lines observed during the outburst stage of VVV-WIT-13. We fit each line with a Gaussian profile (shown in black), with the central radial velocity marked by the dashed lines and noted above each sub-plot (heliocentric frame). Assuming a distance of 2 kpc, the VLSR is −22 km/s (or −15.2 km/s in the heliocentric frame). The measured EW and FWHM are labelled. In the sub-plot of DIB, the grey area is excluded from the Gaussian fitting. |
| In the text | |
|
Fig. 7. Left: Profiles of the 2.12 μm H2 emission lines from the 2021, 2023, and 2024 epochs. Right: K bandpass, CO bandhead absorption features of the 2023 and 2024 spectra. |
| In the text | |
|
Fig. 8. Left: Gaia proper motions (PMs) of 83 group members of SPICY G342.1+0.2. The dashed ring marks the 1σ distribution of PMs from the centre of the group. The PMs of VVV-WIT-13 are obtained from the VIRAC2 catalogue of the VVV survey. The colour bar represents the difference between the PMs measured from Gaia and VVV. Right: PM distance of VVV-WIT-13 (black) and the 83 sources presented in the left panel. |
| In the text | |
|
Fig. 9. Time evolution of the bolometric luminosity of the system. The black curve (dotted line) shows the observational data from VVV-WIT-13 (converted to bolometric), while the red curve (solid line) corresponds to our hydrodynamic model. The time axis of the model has been shifted to align the luminosity peaks. The agreement between the rise and decay timescales suggests that the observed outburst is consistent with the tidal disruption of a giant 5MJ mass planet embryo. |
| In the text | |
|
Fig. B.1. Histograms of Ks and W2 amplitude of the members of SPICY group G342.1+0.2. |
| In the text | |
|
Fig. B.2. ALLWISE colour-colour diagram of sources from SPICY group G342.1+0.2. Data points are colour-coded by their VVV Ks amplitude, as ΔKs < 1 (grey), 1 ≤ ΔKs < 3 (orange), and ΔKs ≥ 3 (red). Mira candidates are marked by squares. The solid lines are boundaries between regions more populated with YSOs (upper left) and Miras (bottom right). |
| In the text | |
|
Fig. B.3. Left: VVV light curves of three eruptive YSO candidates in the SPICY group G342.1+0.2. The name of each source is shown above each plot. Right: Phase-folded VVV light curves of Mira candidates in the SPICY group G342.1+0.2, with periods presented on the x-axis. |
| In the text | |
|
Fig. B4. Proper motions of SPICY group G342.1+0.2 from VIRAC2β catalogue. VVV-WIT-13 is presented as the white star. The VIRAC parallax of this group is shown as the colour bar. |
| In the text | |
|
Fig. C1. Optical spectrum from XSHOOTER, taken in the 2021 epoch. A TiO model with T = 1300 K is presented in red. |
| In the text | |
Current usage metrics show cumulative count of Article Views (full-text article views including HTML views, PDF and ePub downloads, according to the available data) and Abstracts Views on Vision4Press platform.
Data correspond to usage on the plateform after 2015. The current usage metrics is available 48-96 hours after online publication and is updated daily on week days.
Initial download of the metrics may take a while.