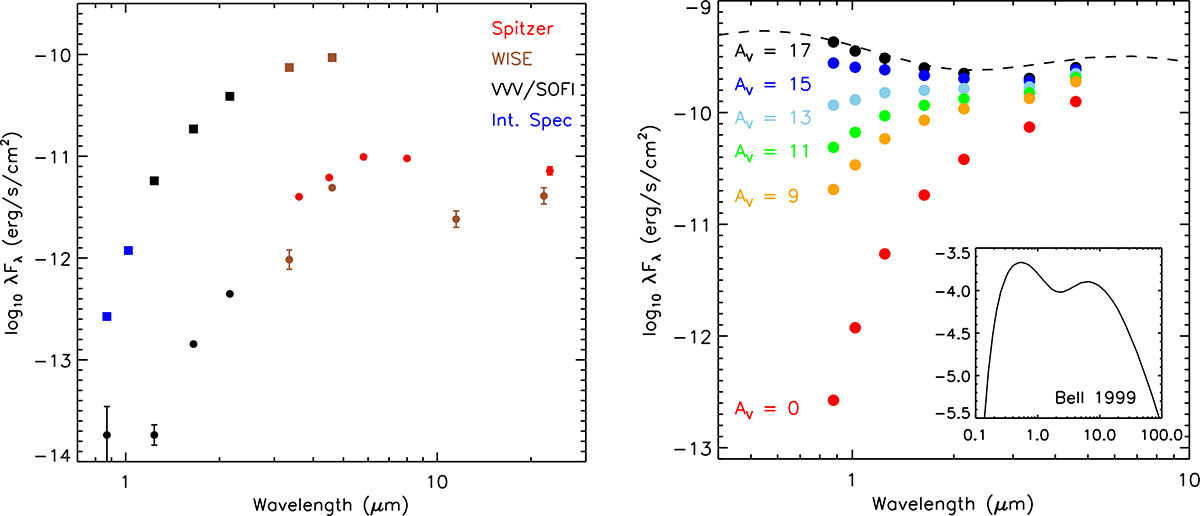
Fig. 4.
Download original image
Left: Spectral energy distribution (SED) of VVV-WIT-13 with data obtained from VVV, SOFI, Spitzer, WISE, and integrated spectra. The pre-outburst SED is shown as dots, and the in-outburst SED is shown as squares. Right: In-outburst SED of VVV-WIT-13 dereddened with AV ranging from 0 to 17 mag. As a comparison, we present the high-mass accretion SED calculated by Bell (1999). We scaled the model to match the SED of VVV-WIT-13, as presented by the dashed line. Error bars smaller than the size of the symbols are not presented.
Current usage metrics show cumulative count of Article Views (full-text article views including HTML views, PDF and ePub downloads, according to the available data) and Abstracts Views on Vision4Press platform.
Data correspond to usage on the plateform after 2015. The current usage metrics is available 48-96 hours after online publication and is updated daily on week days.
Initial download of the metrics may take a while.