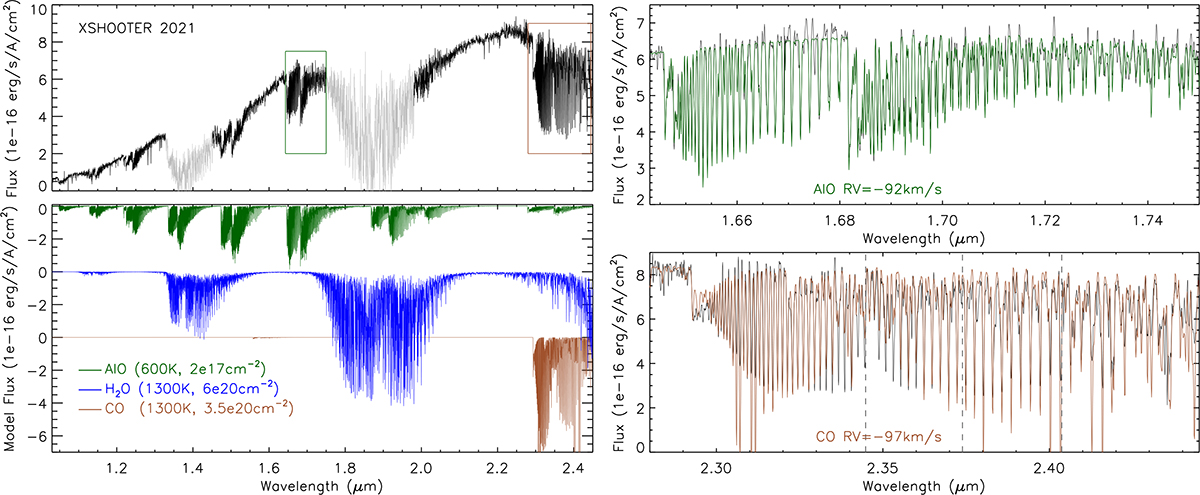
Fig. 5.
Download original image
Upper left: Near-infrared spectrum of VVV-WIT-13 taken during the brightness plateau. The best-fit molecular spectra (AlO, H2O, and CO) are presented in the lower left panel; the effective temperature and column density are labelled in the plot. The coloured squares mark the spectral regions presented in the right panels. The spectral regions among J, H, and K bandpasses are shown in grey, which are dominated by water absorption features. Right: Zoomed-in views of two regions with molecular absorption features, with radial velocity listed in the heliocentric frame. The theoretical wavelengths of 13CO absorption bandheads are shown as dashed grey lines.
Current usage metrics show cumulative count of Article Views (full-text article views including HTML views, PDF and ePub downloads, according to the available data) and Abstracts Views on Vision4Press platform.
Data correspond to usage on the plateform after 2015. The current usage metrics is available 48-96 hours after online publication and is updated daily on week days.
Initial download of the metrics may take a while.