Fig. 9.
Download original image
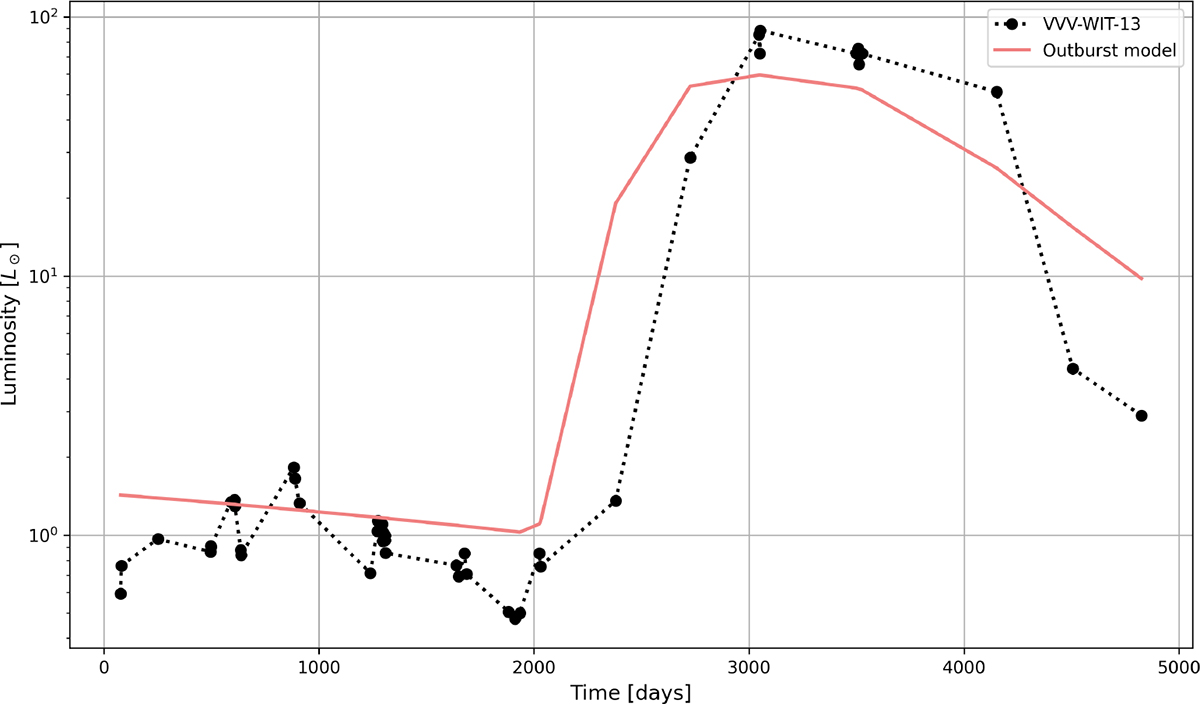
Time evolution of the bolometric luminosity of the system. The black curve (dotted line) shows the observational data from VVV-WIT-13 (converted to bolometric), while the red curve (solid line) corresponds to our hydrodynamic model. The time axis of the model has been shifted to align the luminosity peaks. The agreement between the rise and decay timescales suggests that the observed outburst is consistent with the tidal disruption of a giant 5MJ mass planet embryo.
Current usage metrics show cumulative count of Article Views (full-text article views including HTML views, PDF and ePub downloads, according to the available data) and Abstracts Views on Vision4Press platform.
Data correspond to usage on the plateform after 2015. The current usage metrics is available 48-96 hours after online publication and is updated daily on week days.
Initial download of the metrics may take a while.