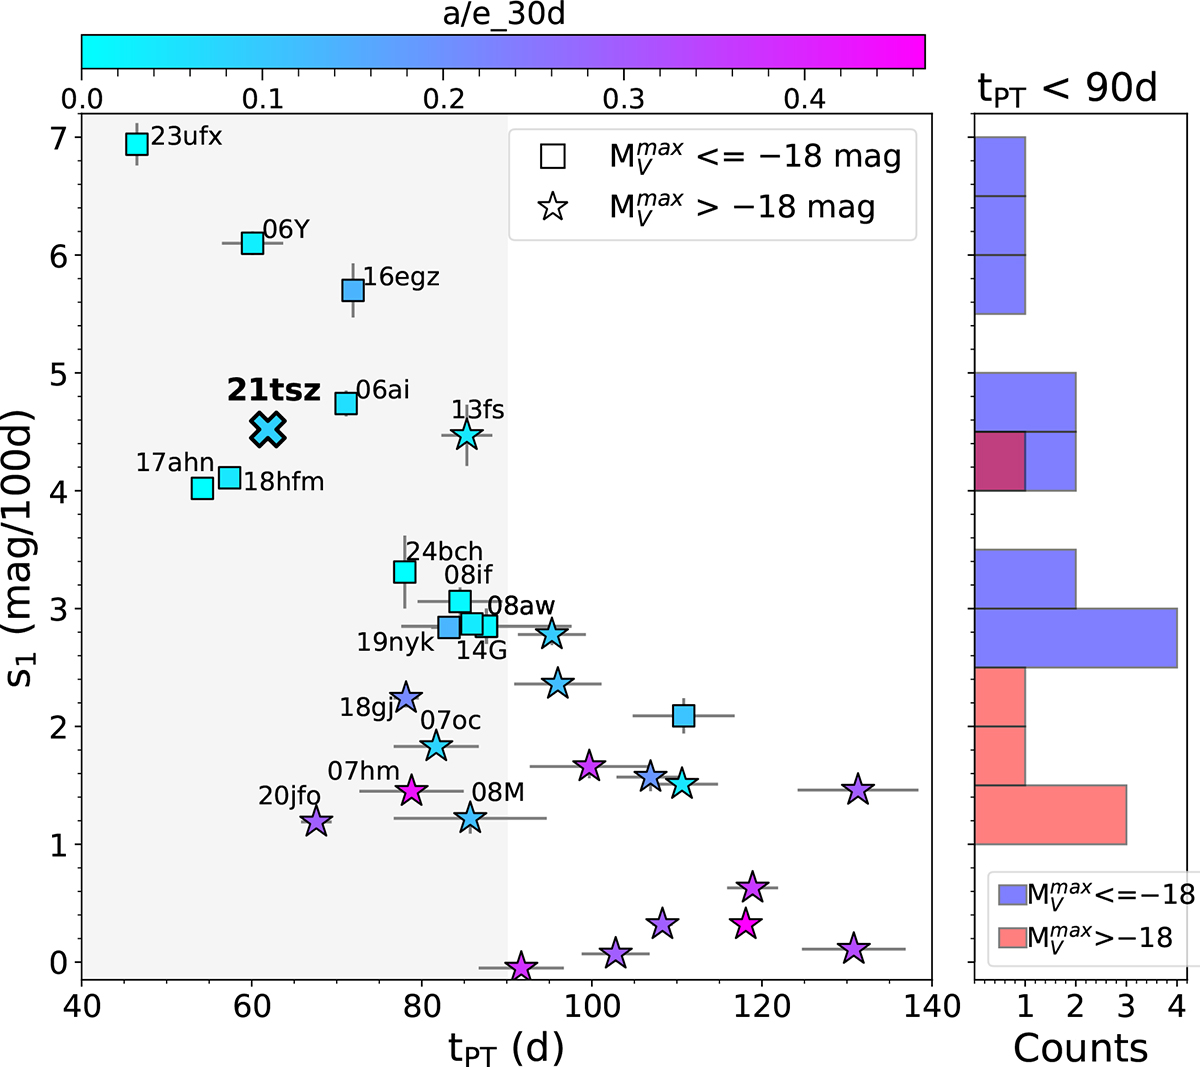
Fig. 10.
Download original image
Position of SN 2021tsz on the V-band slope (s1) vs tPT plot, alongside other SNe II. SNe II with photospheric phases shorter than 90 days are labelled, and this region is shaded in grey. SNe II with peak magnitudes fainter than −18 mag are marked with stars (⋆), while squares denote those brighter than −18 mag. The points are colour-coded by the absorption-to-emission ratio of Hα at 30 days. Data are compiled from the literature (Anderson et al. 2014a; Valenti et al. 2016; Gutiérrez et al. 2017a; Dastidar et al. 2024), along with independent estimates from this work. The right panel shows the histogram of the s1 distribution for SNe II with tPT < 90 days, where those brighter than −18 mag are shown in blue and those fainter than −18 mag in red.
Current usage metrics show cumulative count of Article Views (full-text article views including HTML views, PDF and ePub downloads, according to the available data) and Abstracts Views on Vision4Press platform.
Data correspond to usage on the plateform after 2015. The current usage metrics is available 48-96 hours after online publication and is updated daily on week days.
Initial download of the metrics may take a while.