| Issue |
A&A
Volume 703, November 2025
|
|
|---|---|---|
| Article Number | A224 | |
| Number of page(s) | 17 | |
| Section | Extragalactic astronomy | |
| DOI | https://doi.org/10.1051/0004-6361/202556058 | |
| Published online | 21 November 2025 | |
SN 2021tsz: A luminous, short photospheric phase Type II supernova in a low-metallicity host
1
Millennium Institute of Astrophysics (MAS), Nuncio Monsenor Sòtero Sanz 100, Providencia, Santiago RM, Chile
2
Instituto de Alta Investigación, Universidad de Tarapacá, Casilla 7D, Arica, Chile
3
Aryabhatta Research Institute of Observational SciencES, Manora Peak, Nainital 263001, India
4
Department of Applied Physics, Mahatma Jyotiba Phule Rohilkhand University, Bareilly 243006, India
5
Las Cumbres Observatory, 6740 Cortona Drive Suite 102, Goleta, CA 93117-5575, USA
6
Department of Physics, University of California, Santa Barbara, CA 93106-9530, USA
7
Indian Institute of Astrophysics, Koramangala 2nd Block, Bangalore 560034, India
8
Institut d’Estudis Espacials de Catalunya (IEEC), 08860 Castelldefels, (Barcelona), Spain
9
Institute of Space Sciences (ICE-CSIC), Campus UAB, Carrer de Can Magrans, s/n, E-08193 Barcelona, Spain
10
Goddard Space Flight Center, 8800 Greenbelt Rd, Greenbelt, MD 20771, USA
11
Department of Physics, Royal Holloway – University of London, Egham TW20 0EX, UK
12
Instituto de Astrofísica, Universidad Andres Bello, Fernandez Concha 700, Las Condes, Santiago RM, Chile
13
Oskar Klein Centre, Department of Astronomy, Stockholm University, AlbaNova, SE-106 91 Stockholm, Sweden
14
University of Texas at Austin, 1 University Station C1400, Austin, TX 78712-0259, USA
15
Johns Hopkins University, Bloomberg Center for Physics and Astronomy, San Martin Dr, Baltimore, MD 21210, USA
16
Steward Observatory, University of Arizona, 933 North Cherry Avenue, Tucson, AZ 85721-0065, USA
17
Center for Astrophysics | Harvard & Smithsonian, 60 Garden Street, Cambridge, MA 02138-1516, USA
18
The NSF AI Institute for Artificial Intelligence and Fundamental Interactions, Cambridge, USA
19
Adler Planetarium, 1300 S Dusable Lk Shr Dr, Chicago, IL 60605, USA
⋆ Corresponding author: This email address is being protected from spambots. You need JavaScript enabled to view it.
Received:
23
June
2025
Accepted:
3
October
2025
Abstract
We present the analysis of the luminous Type II Supernova (SN) 2021tsz, which exploded in a low-luminosity galaxy. It reached a peak magnitude of −18.88 ± 0.13 mag in the r band and exhibited an initial rapid decline of 4.05 ± 0.14 mag (100 d)−1 from peak luminosity till ∼30 d. The photospheric phase is short, with the SN displaying bluer colours and a weak Hα absorption component–features consistent with other luminous, short-photospheric phase Type II SNe. A distinct transition from the photospheric to the radioactive tail phase in the V band–as is common in hydrogen-rich Type II SNe–is not visible in SN 2021tsz, although a modest ∼1 mag drop is apparent in the redder filters. Hydrodynamic modelling suggests the luminosity is powered by ejecta-circumstellar material (CSM) interaction during the early phases (< 30 days). Interaction with 0.6 M⊙ of dense CSM extending to 3100 R⊙ reproduces the observed luminosity, with an explosion energy of 1.3 × 1051 erg. The modelling indicates a pre-SN mass of 9 M⊙, which includes a hydrogen envelope of 4 M⊙, and a radius of ∼1000 R⊙. Spectral energy distribution analysis and strong-line diagnostics revealed that the host galaxy of SN 2021tsz is a low-metallicity, dwarf galaxy. The low-metallicity environment and the derived high mass loss from the hydrodynamical modelling strongly support a binary progenitor system for SN 2021tsz.
Key words: supernovae: general / supernovae: individual: SN 2021tsz / supernovae: individual: ZTF21abmwzxt
© The Authors 2025
 Open Access article, published by EDP Sciences, under the terms of the Creative Commons Attribution License (https://creativecommons.org/licenses/by/4.0), which permits unrestricted use, distribution, and reproduction in any medium, provided the original work is properly cited.
This article is published in open access under the Subscribe to Open model. This email address is being protected from spambots. You need JavaScript enabled to view it. to support open access publication.
1. Introduction
Type II supernovae (SNe) result from the core-collapse (CC) of massive stars that retain their hydrogen envelopes, typically with progenitor masses exceeding 8 M⊙ (e.g. Heger et al. 2003; Ibeling & Heger 2013). They are spectroscopically identified by their prominent hydrogen features. This category includes hydrogen-rich SNe that exhibit either slow or fast declining light curves during the photospheric phase, historically referred to as IIP and IIL, respectively (Barbon et al. 1979). It also includes Type IIb SNe, which initially display hydrogen features before transitioning to helium-dominated spectra (Filippenko 1988; Modjaz et al. 2019), and interacting Type IIn SNe, characterised by dominant narrow emission lines arising from interaction of ejecta with circumstellar material (CSM; Schlegel 1990). Recently, a number of hydrogen-rich Type II SNe were observed to exhibit ‘IIn-like’ narrow emission features, popularly known as ‘flash-ionisation’ features (Gal-Yam et al. 2014), which last from a few hours to a week (Khazov et al. 2016; Bruch et al. 2021, 2023; Jacobson-Galán et al. 2024). This duration is unlike what occurs in classical Type IIn SNe, where these features last for several weeks.
Slow-declining hydrogen-rich Type II SNe, traditionally known as the Type IIP SNe, are the most frequently observed, constituting nearly 50% of all CC-SNe (Li et al. 2011; Graur et al. 2017; Shivvers et al. 2017). Stellar evolution models suggest red supergiants (RSGs) as the probable progenitors of the slow-decliners (Heger et al. 2003; Ekström et al. 2012; Eldridge et al. 2017; Zapartas et al. 2019), with confirmation from progenitor detections in deep pre-explosion images indicating a mass range of 8−18 M⊙ (Smartt et al. 2009; Maund et al. 2014; Smartt 2015; Van Dyk 2017 and references therein). Among the hydrogen-rich Type II SNe, SNe 1979C (Branch et al. 1981; de Vaucouleurs et al. 1981) and 1980K (Barbon et al. 1982a; Buta 1982) are regarded as the archetypes of fast-declining Type II SNe. SN 1979C, with a maximum V band magnitude of −19.6, is more luminous than most regular SNe II (median magnitude in V band is −16.7, Anderson et al. 2014a), and an analysis of the stellar population surrounding this SN suggests an RSG progenitor with a mass of ∼17−18 M⊙ (van Dyk et al. 1999). On the other hand, for SN 1980K, no star was detected at the SN position in pre-explosion images, possibly indicating a blue supergiant with a mass ranging from 10−15 M⊙ (Smartt et al. 2009) as the likely progenitor. Direct progenitor detection of fast-declining Type II SNe has not been as common as for the slow-decliners, and for the few cases that exist, the progenitor identification has been inconclusive (e.g. SN 2009kr, Elias-Rosa et al. 2010; Fraser et al. 2010; Maund et al. 2015).
Numerous investigations, including those by Patat et al. (1994) and more recent studies by Arcavi et al. (2012), Anderson et al. (2014a), Faran et al. (2014), Sanders et al. (2015), Rubin et al. (2016), Rubin & Gal-Yam (2016), Valenti et al. (2016), Gutiérrez et al. (2017a), Martinez et al. (2022), Silva-Farfán et al. (2024), have extensively analysed samples of hydrogen-rich Type II SNe. A consistent finding is that faster-declining Type II SNe tend to exhibit higher peak luminosities, shorter photospheric phases, faster expansion velocities, and weaker Hα P Cygni absorption compared to their slower-declining counterparts. The latter two characteristics are likely attributable to a lower H-envelope mass (Schlegel 1996; Gutiérrez et al. 2014, 2017b) and steeper envelope density gradients in the progenitor (Dessart & Hillier 2005; Dessart et al. 2013; Gutiérrez et al. 2014), while the higher peak luminosities of fast-declining Type II SNe are suggested to be associated with dense CSM around the progenitor (Blinnikov & Bartunov 1993; Morozova et al. 2017, 2018; Hillier & Dessart 2019).
There is an apparent scarcity of hydrogen-rich Type II SNe with peak absolute magnitudes between −18 and −20 mag compared to the more common normal-luminosity Type II SNe (−16.74 ± 1.01 mag, Anderson et al. 2014a). While the peak magnitudes of Type IIn SNe overlap with this range, typically around −16.5 to −21.5 mag (Li et al. 2011; Kiewe et al. 2012; Taddia et al. 2013; Nyholm et al. 2020; Hiramatsu et al. 2024), their luminosity is significantly influenced by ejecta-CSM interaction. Type II SNe that are brighter than −20 mag, reaching up to −22.5 mag, are classified as superluminous SNe II (SLSNe II; Gal-Yam 2012; Inserra et al. 2018 and references therein). Arcavi et al. (2014) investigated events that bridge the gap between regular Type II SNe and SLSNe II, using the hydrogen-rich CC-SN sample from the Palomar Transient Factory (PTF; Law et al. 2009; Rau et al. 2009). Among the four events identified, only one (PTF10iam) was characterised as a luminous Type II SN with a rapid rise to peak brightness. Later, Pessi et al. (2023) systematically examined the extended Public ESO Spectroscopic Survey of Transient Objects (ePESSTO+; Smartt et al. 2015) Marshall from 2017 to 2019 and identified 34 Type II SNe with peak absolute magnitudes within this luminosity gap. Among them, six showed atypical spectral features, lacking the canonical Hα P Cygni profile and instead displaying broad emission with flat absorption. However, their light curves deviated from the norm for Type II SNe, exhibiting no distinct drop from the photospheric phase to the radioactive tail. The prototypical fast-declining Type II SNe 1979C and 1980K, which also show a similar Hα profile, do exhibit a distinct transition between the recombination phase and the radioactive tail, unlike the events in the Pessi et al. (2023) sample. A few luminous SNe II have also been reported to exhibit unusually shorter photospheric phases. Hiramatsu et al. (2021) presented an extensive analysis of three such SNe–2006ai, 2006Y, and 2016egz–with photospheric phases shorter than 70 days. SN 2023ufx and KSP-SN-2022c (also known as AT 2022ozg) are two recent additions to this luminosity gap, and they also exhibit a short photospheric phase and spectra lacking Hα P Cygni absorption (Tucker et al. 2024; Ravi et al. 2025; Jiang et al. 2025).
In regular Type II SNe, the release of shock-deposited energy is believed to be the primary source powering the SN. However, for their luminous counterparts, additional energy sources are necessary. Various powering mechanisms have been suggested for luminous SNe II (e.g. see Kasen 2017). Radioactive decay energy from a significant amount of 56Ni produced during the explosion can significantly contribute to the SN powering mechanism, enhancing observed luminosity. In addition, CSM interaction has been proposed as a potential powering mechanism for several luminous SNe II; sometimes it has manifested in the early spectra as narrow emission lines persisting for hours to a week. However, the formation of these lines is contingent on CSM density and extent. Some studies have also suggested that some luminous SNe II could be driven by energy deposition from magnetars (Orellana et al. 2018). The luminosity of an SN has also been proposed to be correlated with the metallicity of the environment. Taddia et al. (2016) demonstrated that SNe II with brighter peak magnitudes tend to occur in lower metallicity environments, as massive progenitors are more likely to form in such environments, leading to brighter explosions (but also see Gutiérrez et al. 2018; Grayling et al. 2023, where such correlation is not observed).
In this paper, we present a comprehensive analysis and light curve modelling of a luminous SN II, SN 2021tsz, with a fast-declining light curve and a short photospheric phase, located in the faint host galaxy SDSS J233758.39−002629.6 (mr = 20.11 ± 0.03 mag, Mr = −16.04 ± 0.05 mag). SN 2021tsz (also known as ZTF21abmwzxt, ATLAS21bccc, Gaia21dmi, and PS21ikp) was discovered by the Zwicky Transient Facility (ZTF; Bellm et al. 2019) at RA(2000) = 23h37m58 39 and Dec(2000) = −00°26′29
 38 on 2021 July 19.4 UT (JD 2459414.9) and reported by the Automatic Learning for the Rapid Classification of Events (ALeRCE; Förster et al. 2021) broker team (Munoz-Arancibia et al. 2021). There is also a close detection from the Asteroid Terrestrial-impact Last Alert System (ATLAS; Tonry et al. 2018; Smith et al. 2020) survey in the c-band on 2021 July 19.5 UT (JD 2459415.0). The SN is located 0.12″ S, 0.00″ W from the galaxy centre and is depicted in Fig. A.1. ALeRCE’s stamp classifier (Carrasco-Davis et al. 2021) classified the event as an early SN candidate. The discovery magnitude of the event was 18.3 AB mag in the ZTF g-filter. The last non-detection with ZTF was on 2021 July 16.5 UT (JD 2459412.0), at a limiting magnitude of 20.2 AB mag in the r-band. However, a more recent non-detection was recorded with ATLAS in the o-filter on 2021 July 17.6 UT (JD 2459413.1) at a limiting magnitude of 21.0 mag. A spectrum of the SN was obtained by the ePESSTO+ team (Smartt et al. 2015) on 2021 August 02.9 UT with the EFOSC2 and Grism 13 (3985−9315 Å, 18 Å resolution) mounted on the ESO New Technology Telescope (NTT) at La Silla and classified as SN II (Pessi et al. 2021). We will use the mid-point between the last non-detection (from ATLAS) and first detection (from ZTF) as the explosion epoch, which is JD 2459414.0 ± 0.9. SN 2021tsz reached a peak absolute magnitude of −18.96 in the g band. Noteworthy features of this event include the short photospheric phase, very short fall from the photospheric to the radioactive decay tail, and the weak H-absorption component in the spectra during the photospheric phase.
The paper is organised as follows: Data reduction procedures are outlined in Section 2. Section 3 focuses on constraining the explosion epoch and certain host galaxy properties, including distance and reddening. In Section 4, we delve into the analysis of the light curve, colour curve, and the estimation of the 56Ni mass ejected in the explosion. Section 5 is dedicated to spectral analysis, encompassing a comparison of the spectral characteristics with those of other SNe II and literature model spectra. The progenitor, explosion, and CSM parameters, including explosion energy, ejecta mass, and CSM mass, are determined through bolometric light curve modelling in Section 6. In Section 7, we compare the parameters from our modelling with those from previous modelling works of similar Type II SNe and discuss the probable progenitor and mass loss scenario. Lastly, the paper concludes with a summary in Section 8.
2. Observations and data reduction
Photometric observations of SN 2021tsz in the optical BgVri bands began approximately 11 days after its discovery and continued till 160 days. These observations were conducted using Sinistro cameras on the 1-m telescopes of the Las Cumbres Observatory (LCO) as part of the Global Supernova Project (GSP) collaboration (Brown et al. 2013). Data collection extended over a period of 160 days post-discovery. Image pre-processing, including bias correction and flat-fielding, is performed using the BANZAI pipeline (McCully et al. 2018). Subsequent data reduction is handled with the lcogtsnpipe pipeline (Valenti et al. 2016), a photometric reduction tool built on PYRAF. This pipeline calculates zero-points and colour terms and extracts magnitudes using the point-spread function technique (Stetson 1987). Although the SN exploded in a faint host galaxy, its apparent magnitudes during the nebular phase diminished to the luminosity level of the host, making template subtraction necessary to remove host contamination. We performed template subtraction across the entire light curve using host galaxy template images obtained on September 6, 2024, with the PyZOGY image subtraction algorithm (Zackay et al. 2016; Guevel & Hosseinzadeh 2017) integrated within the lcogtsnpipe pipeline. The photometry in the BV bands is presented in Vega magnitudes, while the data for the gri bands are presented in AB magnitudes, calibrated using the American Association of Variable Star Observers (AAVSO) Photometric All-Sky Survey (APASS, Henden et al. 2016) catalog. The final calibrated photometric data from LCO are compiled in Table A.4.
We also include the ZTF g, r and i bands forced photometry data in this study. The ZTF forced-photometry data, obtained from the forced photometry server (Masci et al. 2023), is further processed to discard outliers and large error data points following the procedure in Hernández-García et al. (2023). The ZTF photometry is reported on the AB magnitude scale and is calibrated using Pan-STARRS1 Survey (PS1) sources (Masci et al. 2019). The ZTF data is provided in Table A.3. We also obtained photometry from the ATLAS forced-photometry server (Shingles et al. 2021) in the ATLAS c and o filters at the position of SN 2021tsz. The fluxes of the observations were averaged using a weighted mean on a nightly cadence and tabulated in Table A.5.
Spectroscopic observations of SN 2021tsz were initiated ∼7 days after discovery using the low-resolution FLOYDS spectrographs on the 2-m Faulkes Telescope North and South (FTN and FTS, Brown et al. 2013) as part of the GSP collaboration. The FLOYDS spectra cover a wavelength range of ∼3200−10 000 Å with a resolution of ∼18 Å. However, due to fringing effects at the reddest wavelengths, the signal-to-noise ratio beyond 7500 Å is low. The spectra are reduced using the floydsspec1 pipeline, which employs standard reduction techniques. Additionally, the reduced classification spectrum obtained by the ePESSTO+ team is downloaded directly from the TNS (Transient Name Server2). The reduced spectra are then scaled to the BgVri photometry of the corresponding epoch using the lightcurve-fitting3 module (Hosseinzadeh & Gomez 2022). The log of spectroscopic observations of SN 2021tsz is given in Table A.2.
3. Host galaxy properties
3.1. Distance and extinction
The host galaxy of SN 2021tsz, SDSS J233758.39−002629.6, is faint with photometric data available from the SDSS archive, but lacks a spectroscopic redshift. To constrain the redshift, we obtained a host galaxy spectrum with the Inamori-Magellan Areal Camera and Spectrograph (IMACS) and grating 150 on the 6.5 m Magellan-Baade telescope (Dressler et al. 2011), with an exposure of 1800s on 2024 July 7. Prominent features include hydrogen Balmer lines, Hα and Hβ, and nebular lines such as, [O III] λλ4959,5007 and [N II] λ6583. We estimated the redshift from Hβ, [O III] λλ4959,5007, yielding a mean redshift of 0.0366 ± 0.0020. As a sanity check, we estimated the redshift from narrow Hα emission visible atop the broad Hα P-Cygni profile in SN 2021tsz spectra, obtaining 0.0364 ± 0.0006, where the error is the standard deviation of the measured redshifts. To account for uncertainties in the redshift and the local peculiar motion of the host galaxy, we combine the redshift measurement error with a redshift uncertainty corresponding to a peculiar velocity of 180 km s−1, added in quadrature. The peculiar velocity of the galaxy is estimated using the Carrick et al. (2015) peculiar velocity model4. We compute luminosity distances using the Planck Collaboration VI (2020) cosmological parameters from the ASTROPY.COSMOLOGY package, adopting a flat ΛCDM cosmology with H0 = 67.66 ± 0.42 km s−1 Mpc−1 and Ωm = 0.3111 ± 0.0056. We propagate these uncertainties using a Monte Carlo approach: we draw 10 000 samples from Gaussian distributions of redshift, H0, and Ωm and compute the luminosity distance for each realisation using ASTROPY.COSMOLOGY. The final distance and its uncertainty are taken as the median and the 68% confidence interval of the resulting distribution, which is 166.7 ± 9.8 Mpc, and the corresponding distance modulus is μ = 36.10 ± 0.12 mag.
The Galactic reddening E(B − V)MW in the line of sight of the SN is 0.0297 ± 0.0018 mag, obtained from the extinction dust maps of Schlafly & Finkbeiner (2011). There is no conspicuous narrow NaID absorption in the host galaxy spectrum at the redshift of the host galaxy. Hence, we assume negligible host-galaxy extinction and do not include any contribution to the reddening of the SN from the host.
3.2. Recent and ongoing star formation rate
To accurately measure emission line fluxes, we fitted the stellar continuum of the host spectrum using FIREFLY (Fitting IteRativEly For Likelihood analYsis, v1.0.3, Wilkinson et al. 2017; Neumann et al. 2022) with stellar population models from Maraston et al. (2020) and assuming a Chabrier (2003) initial mass function (IMF), and a resolving power of 650. The host spectrum, with the best-fit stellar continuum and subtracted host galaxy spectrum, is shown in the top and bottom panels of Fig. 1, respectively. The subtracted host galaxy spectrum was used to measure the emission line fluxes by a Gaussian fit.
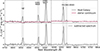 |
Fig. 1. Top panel: Spectrum of the host galaxy SDSS J233758.39−002629.6 of SN 2021tsz, overlaid with the best-fit stellar continuum model obtained using FIREFLY. Prominent emission lines, including Hα, Hβ, [O III] λλ4959,5007, and [N II] λ6583, are marked. Bottom panel: Host galaxy spectrum after subtraction of the stellar continuum model, highlighting the nebular emission lines used for redshift, SFR, and metallicity diagnostics. |
We use the Hα and ultraviolet (UV) emission to trace the ongoing (< 16 Myr old) and recent (16−100 Myr old) star formation history of the host galaxy, respectively (Gogarten et al. 2009). From the Hα flux of 5.2 × 10⁻¹⁶ erg cm−2 s−1, we derived an ongoing star formation rate (SFR) of 0.0084 ± 0.0003 M⊙ yr−1 using the relationship between Hα luminosity and SFR Eq. (2) from Kennicutt (1998) and the scaling factor of 0.63 from Madau & Dickinson (2014) to convert from the Salpeter to the Chabrier IMF in the Kennicutt (1998) relation. The far ultraviolet (FUV) magnitude was obtained as 23.31 ± 0.24 mag from the Galaxy Evolution Explorer (GALEX) source catalog (Seibert et al. 2012) accessed through the NASA Extragalactic Database (NED; Helou et al. 1991). After correcting for the line-of-sight MW extinction, we transformed the FUV magnitude into SFR using Eq. (3) of Karachentsev & Kaisina (2013):
![Mathematical equation: $$ \begin{aligned} \log _{10}(\mathrm{SFR} [\mathrm{M}_\odot \,\mathrm{yr}^{-1}]) = 2.78 - 0.4 m^c_{\rm FUV} + 2\log (D [\mathrm{Mpc}]), \end{aligned} $$](/articles/aa/full_html/2025/11/aa56058-25/aa56058-25-eq3.gif)
where mFUVc is the FUV apparent magnitude corrected for total line of sight extinction, and D [Mpc] is the distance to the host galaxy in Mpc. We obtained log10(SFR [M⊙ yr−1]) as −2.02 ± 0.10, corresponding to an SFR of 0.0096 ± 0.0022 M⊙ yr−1. Both methods yield comparable SFR values, indicating a stable star formation history over the last 100 Myr.
3.3. Spectral energy distribution analysis
To further assess the physical properties of the host galaxy, we performed spectral energy distribution (SED) analysis using multi-band photometric measurements from SDSS (ugriz), GALEX (FUV, NUV), and Wide-field Infrared Survey Explorer (WISE; Wright et al. 2010) band 1. The SED was modelled using the CIGALE (Code Investigating GALaxy Emission; Boquien et al. 2019) software, assuming a double exponential star formation history, a Chabrier (2003) IMF, the stellar population models of Bruzual & Charlot (2003), the Calzetti et al. (2000) attenuation law, and Dale et al. (2014) dust templates. The CIGALE configuration was adopted from Table 9 of Das et al. (2023). The best fit, chosen using Bayesian inference, yielded a stellar mass of log(M⋆/M⊙) = 8.1 ± 0.2, with both recent (100 Myr) and ongoing (10 Myr) SFR of 0.13 ± 0.08 M⊙ yr−1. Consequently, the specific SFR is log(sSFR [yr−1]) = −8.9 ± 0.3. The value is significantly higher than the SFR derived from Hα line flux, however, the latter is known to have limitations as SFR tracers in dwarf galaxies (Bothwell et al. 2009). The SED-derived value falls within the typical sSFR range of dwarf galaxies on the star formation main sequence (log(sSFR) ∼ −9.6 ± 0.8 yr−1; Huang et al. 2012).
3.4. Metallicity and nebular line diagnostics
The intensity ratios of flux between [N II] λ6584 and Hα, and between [O III] λ5007 and Hβ were found to be log([N II]/Hα) = −1.17 ± 0.09 and log([O III]/Hβ) = 0.52 ± 0.02, respectively. These ratios are consistent with those of star-forming regions on the BPT diagram (Baldwin et al. 1981). Using these line fluxes, the metallicity of the host galaxy was estimated as 12 + log(O/H) = 8.17 ± 0.03 dex (∼0.3 Z⊙) using the empirical relationship Eq. (2) from Marino et al. (2013). The low-metallicity environment of the host galaxy further reinforces the dwarf nature of the host. The SN and the host galaxy parameters are summarised in Table A.1.
4. Light curve analysis
The BgVri light curves of SN 2021tsz, along with ZTF-g, r, i, and ATLAS c and o bands, are shown in Fig. 2. The light curves peak at absolute magnitudes of −18.96 ± 0.13, −18.88 ± 0.13, and −18.85 ± 0.13 mag in g, r, and i bands, at 11.6 ± 0.9, 11.9 ± 1.6, and 12.4 ± 1.7 days post-explosion, respectively. González-Gaitán et al. (2015) found that Type II SNe rise times span a 1σ range of 4−17 days, independent of the filter, placing SN 2021tsz within this distribution. Moreover, Gall et al. (2015) reported a mean rise time of 13.3 ± 0.6 days for fast-declining SNe II in a sample of 20 CCSNe, which is consistent with the rise time of SN 2021tsz.
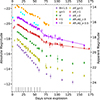 |
Fig. 2. BgVri, ZTF gri, and ATLAS c, o-band light curves of SN 2021tsz offset by values as shown in the legend. ZTF gri magnitudes are in the SDSS photometric system. The absolute magnitudes are corrected for distance and reddening as listed in Table A.1. Parametrised fit to the r and i band light curves are also shown (Olivares et al. 2010). The vertical grey lines denote the epochs at which a spectrum of SN 2021tsz was obtained. |
After peak brightness, the light curves decline rapidly until ∼60 days. Type II SNe decay rates are often characterised by two slopes: an initial steep slope (s1) following peak brightness and a shallower slope (s2), preceding the end of the photospheric phase (Anderson et al. 2014a). A break in the r-band and ATLAS o-band slopes is apparent at 40 days, while other bands show no significant change. A second break, around 50−55 days, is observed across all bands, marking the end of the photospheric phase. This transition from the photospheric phase to the radioactive tail phase is marked by a drop in magnitude, referred to as the transition phase. The transition phase is also marked by a shift towards bluer colours as discussed in Sect. 4.1.
We fit the r and i band light curves using Eq. (4) from Olivares et al. (2010) to estimate parameters of the transition phase: the magnitude drop (a0) and the time from the explosion to the transition point between the end of the plateau and the start of the radioactive tail phase, tPT. A distinct drop of (a0) 0.90 ± 0.08 mag (0.87 ± 0.15 mag) occurs between 55−70 days, with tPT = 63.2 ± 1.6 d (64.6 ± 2.2 d) in the r (i) band. The fits are overlaid on the observed r and i band data in Fig. 2. After day 75, the light curves in the B, g, V, r and i bands decline at rates of 1.5, 1.5, 1.4, 0.9, and 1.6 mag (100 d)−1, respectively. We report the BgVri light curve slopes at different phases in Table A.6.
To analyse the photometric and spectroscopic properties of SN 2021tsz, we constructed a comparison sample of Type II SNe with peak magnitudes brighter than −18 mag and post-peak decline rates exceeding 1 mag (100 d)−1. This sample comprises the fast-declining prototypes SNe 1979C, 1980K, and 2014G. Additionally, Type II SNe from the literature with photospheric phase durations on the shorter end of the Type II distribution (< 80 days): SNe 2006Y, 2006ai, 2016egz, 2017ahn, 2018gj, 2018hfm, 2020jfo, 2023ufx, and 2024bch, are included irrespective of their peak luminosity. Table A.7 lists the comparison sample along with their parameters and corresponding references.
4.1. Colour evolution
The evolution of extinction-corrected B − V colour for SN 2021tsz is shown in Fig. 3, alongside SNe from the comparison sample and the regular SN II sample from de Jaeger et al. (2018) (hereafter J18). The J18 sample consists of an unreddened sample of 19 SNe II with negligible host extinction, while the rest are extinction-corrected colours of SNe II. A non-parametric smoother, LOESS-locally weighted running line smoother (Cleveland 1979), was applied to fit the B and V band light curves before estimating the colours for all comparison SNe. The B − V colour of SN 2021tsz gradually shifts to redder colours, from 0.23 to 1.35 mag, until ∼60 days post-explosion. This evolution is consistent with the trend observed in the J18 sample. The SNe in the comparison sample, while following a similar redward evolution, generally exhibit comparatively bluer colours.
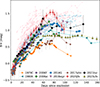 |
Fig. 3. B − V colour curve of SN 2021tsz compared to those of the comparison sample SNe. The colour of SN 2021tsz and the comparison sample are extinction corrected. Prior to estimating the colour, LOESS regression was applied to smooth out the B and V band light curves of all SNe. In the background, the unreddened sub-sample of 19 SNe II from de Jaeger et al. (2018) is shown in blue, while the rest of the sample SNe with extinction correction applied are shown in pink. |
Between 60 and 80 days, SN 2021tsz undergoes a transition towards bluer colours, shifting from 1.35 to 1.10 mag. Subsequently, it shows little change, maintaining a nearly constant colour of 1.1 mag. This transition towards bluer colours is characteristic of all SNe II as they enter the nebular phase. At this phase, the optically thin envelope can no longer thermalise the photons from radioactive decay, resulting in bluer colours. The timing of this transition coincides with the light curve evolution from the photospheric phase to the radioactive tail phase, occurring around 70 days in SN 1980K, 85 days in SN 2014G, and 60 days in SN 2021tsz (also see Fig. 4). After 80 days, the B − V colour of SN 2021tsz is similar to SN 2014G, while most other SNe in the comparison sample exhibit much bluer colours. Overall, while luminous SNe II tend to exhibit bluer B − V colours, their colour evolution is similar to that of traditional SNe II. The bluer colours may be attributed to interactions with the surrounding CSM, which generates additional thermal energy. Finally, we note that CSM interaction can also result in a bluer colour during the nebular phase. However, the blueward turn associated with CSM interaction is expected to be slow and gradual, whereas the change observed here is more rapid and coincides with the expected timing of the end of recombination phase.
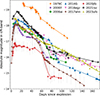 |
Fig. 4. Comparison of absolute r band light curve of SN 2021tsz with those of the comparison sample. The magnitudes have been corrected for distance and reddening as listed in Table A.7. |
4.2. Absolute magnitude and 56Ni mass
The evolution of the R/r band absolute magnitude for SN 2021tsz is shown alongside SNe from the comparison sample in Fig. 4. The peak r-band magnitude of SN 2021tsz is brighter than most SNe in the comparison sample, with the exception of SN 1979C. Some events, such as SNe 2017ahn and 2021tsz, exhibit a linearly declining light curve during the photospheric phase, while others–like SNe 2006Y and 2023ufx–show a rapidly cooling phase followed by a plateau. The short photospheric phase sample spans a wide magnitude range, with SN 2020jfo at the faint end, being ∼2 mag fainter than SN 2021tsz, and SN 1979C at the bright end. Compared to the well-observed, fast-declining SN 2014G, SN 2021tsz is ∼0.5 mag brighter at peak, has a shorter photospheric phase and a smaller luminosity drop at the end of this phase than SN 2014G.
The amount of 56Ni synthesised during an explosion is typically estimated from the luminosity of the radioactive tail phase in most Type II SNe. We use the bolometric correction (BC) method to derive the tail bolometric luminosity and estimate the 56Ni mass. While Hamuy (2003) provided a BC for the V band based on three SNe II, more recently, Rodríguez et al. (2021) analysed a sample of 15 SNe II with BV(r)R(i)IJHK photometry and three theoretical spectral models to calibrate the BC values. They concluded that the i band is better suited for estimating 56Ni mass compared to the V and r bands, as the constant BCs in the latter overestimate the tail bolometric luminosity and, consequently, the 56Ni mass for moderately luminous SNe II. Using Sloan i band magnitudes from 101 to 134.6 days post-explosion and the BC values provided in Table 9 of Rodríguez et al. (2021), we estimated a 56Ni mass of 0.08 ± 0.01 M⊙. This coincides with the upper end of the distribution of 56Ni masses for Type II SNe (Müller et al. 2017; Anderson 2019; Rodríguez et al. 2021). For comparison, 56Ni masses derived from V and r-band tail luminosities in the same time range are 0.10 ± 0.02 and 0.13 ± 0.02 M⊙, respectively, both higher than the estimation from the i-band. Therefore, for light curve modelling in Sect. 6, we adopt the 56Ni mass estimated from the i-band magnitudes. We note, however, that in cases of strong CSM interaction during the nebular phase, this method may yield an overestimate of the actual 56Ni synthesised in the explosion. The value we report should therefore be regarded as an upper limit.
5. Spectral analysis
5.1. Spectral evolution
The spectral evolution of SN 2021tsz from 8.0 to 61.0 days is shown in Fig. 5. Up to 14.9 days, the spectra exhibit a blue continuum, with the Hα emission line becoming prominent in the 18.9 day spectrum. Hβ and Hγ absorption lines are also evident at this epoch. A narrow emission atop the broad Hα profile is consistently observed at the same wavelength, likely originating from host galaxy Hα emission. An absorption feature around 5700 Å emerges in the 18.9 day spectrum, which may correspond to He I, NaID, or a combination of both. Beyond one month, the spectra are dominated by strong and broad Hα emission (full width at half maximum, FWHM velocity, v ≈ 8000 − 9000 km s−1), with minimal to no P Cygni absorption. The emergence of Fe IIλ5169 and the near infrared (NIR) Ca II triplet is evident in the 28.1 day spectrum.
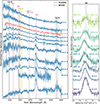 |
Fig. 5. Spectral evolution of SN 2021tsz from 8.0 to 61.0 days after explosion, with prominent lines marked. Right panel: Evolution of the Hα profile in velocity space (centred at the rest wavelength of Hα) for spectra with S/N > 5. The broad component is shown after subtraction of the narrow Gaussian (FWHM ∼ 10 Å) with its best-fit profile overplotted with black dashed lines. The corresponding narrow component, attributed to the host galaxy, is indicated by grey dashed lines. |
At early times, the dense and hot ejecta result in a higher population of hydrogen atoms in the n = 2 state (responsible for Hβ), leading to stronger Hβ absorption compared to Hα under cooler conditions. However, in SN 2021tsz, the Hα absorption component is weak even during the photospheric phase. This may be attributed to photons generated from interaction of CSM with high-velocity outer ejecta filling the Hα absorption trough. Hβ, Hγ, and Hδ are not similarly affected because the CSM is still in its early phase and optically thick. Thus, the high optical depth efficiently converts the higher-order Balmer-series photons from the interaction into Hα, resulting in a steep Balmer decrement (Chevalier & Fransson 1994; Zhang et al. 2022).
Dessart & Hillier (2022) suggested that a spherical dense shell swept up by the shock may generate high-velocity emission that fills the blue-shifted absorption and produces a red excess in emission. This effect depends on the density of the shell, which sets the shock power and, in turn, the strength of these features. In SN 2021tsz, the absence of a red excess and a weak Hα absorption component may instead indicate an asymmetric shock-swept dense shell, pointing to an aspherical shock and/or an aspherical CSM configuration.
In the right panel of Fig. 5, the evolution of Hα in the velocity space is shown for the spectra with signal-to-noise ratio (S/N) greater than five. The profile is initially fitted with two Gaussian components, a narrow and a broad one. The narrow component, consistently well-reproduced with a Gaussian of FWHM ∼ 10 Å across all epochs, most likely originates from the host galaxy. In the figure, we present the broad component after subtracting this narrow contribution; the fit to the broad profile is overplotted, while the narrow component atop the broad profile is shown as grey dashed lines. The broad Hα peak is blue-shifted until 48.9 days, after which it becomes more symmetric about the rest wavelength. Such early blue-shifts are typical in Type II SNe, arising from resonance photon scattering in an atmosphere dominated by electron scattering opacity (Chugai 1988; Jeffery & Branch 1990). Alternatively, they have been linked to steep ejecta density profiles that enhance occultation of the receding material (Anderson et al. 2014b), with spectral models confirming that such profiles naturally reproduce the observed blueshifted lines (Dessart & Hillier 2005).
5.2. Comparison with other SNe
In Fig. 6, we compare the photospheric spectrum of SN 2021tsz at 48.9 day with those of the comparison sample SNe at similar epochs. All the spectra are de-redshifted and dereddened before comparison. The spectrum of SN 2021tsz closely resembles those of SNe 1979C, 2006Y, and 2017ahn. The spectrum of SN 2021tsz lacks prominent Hα absorption and displays weak Fe II lines, similar to the comparison sample, except for SNe 2014G and 2020jfo. The suppression of Hα absorption typically suggest the presence of a massive, dense shell formed by swept-up material (Dessart et al. 2016). Additionally, the weaker Ca II NIR absorption in SN 2021tsz as well as in the other short photospheric phase Type II SNe 2006Y, 2017ahn and 2023ufx compared to SNe 2014G and 2020jfo indicates that the interaction power injected into the outer ejecta layers increased the abundance of Ca2+, leading to the quenching of the Ca II NIR absorption (Dessart & Hillier 2022). A stronger interaction power can cause complete ionisation, resulting in very weak or absent Ca II features, as observed in SN 2006Y. The spectrum of SN 2021tsz also shows fewer lines below 6000 Å compared to SN 2014G. This could imply either a higher temperature for SN 2021tsz relative to SN 2014G or a metallicity effect (Dessart et al. 2014; Anderson et al. 2016; Gutiérrez et al. 2018). Since the temperature estimated from the continuum of the 45 day spectrum of SN 2014G (∼5200 K) is comparable to that of SN 2021tsz, the latter explanation – metallicity – is more plausible. This interpretation is consistent with the low-metallicity of SN 2021tsz’s host. Overall, the spectrum of SN 2021tsz is akin to other SNe II with fast-declining light curves and short photospheric phases, such as, SNe 2006Y, 2006ai, and 2016egz. However, it is markedly different from the slow-declining, short-photospheric-phase SN 2020jfo, which shows strong absorption of H I and other metal lines. The cut-out on the right, which focuses on the Hα region in velocity space, highlights the area corresponding to twice the FWHM velocity of Hα emission in SN 2021tsz. With the exception of SN 2023ufx, whose spectrum exhibits a distinct blue excess in the Hα emission, neither SN 2021tsz nor the comparison sample shows such excess in the 50 day spectrum.
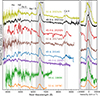 |
Fig. 6. Comparison of 48.9 day spectrum of SN 2021tsz with similar epoch spectra of the comparison sample corrected for both redshift and reddening. On the right, a cut-out of the Hα region is shown in the velocity space, centred at the rest wavelength of Hα. |
We compare the velocity evolution of Hβ and Fe IIλ5169, determined from their respective blue-shifted absorption minima, in the spectra of SN 2021tsz with those SNe from our comparison sample and the mean velocities from the Type II sample in Gutiérrez et al. (2017a) in Fig. 7. The Hβ velocities of SN 2021tsz are at the upper end of the velocity distribution of the Gutiérrez et al. (2017a) sample, similar to SNe 2006Y and 2014G, but lower than SN 2023ufx. Similarly, the Fe IIλ5169 velocity of SN 2021tsz lies at the upper end of the corresponding distribution from Gutiérrez et al. (2017a), comparable to SN 2006Y but lower than SN 2014G at the early phases. Furthermore, we note that SN 2021tsz and other fast-declining, short photospheric phase SNe II have higher velocities than the slow-declining, short photospheric phase SN 2020jfo.
 |
Fig. 7. Expansion velocity of SN 2021tsz is shown along with that of the comparison sample SNe and the mean velocity (grey) of 122 IIP/IIL SNe (Gutiérrez et al. 2017a) for Hβ (top panel) and Fe IIλ5169 (bottom panel). The light grey regions represent the standard deviations of the mean velocities of the sample. |
6. Hydrodynamical modelling of light curve
The SN 2021tsz displays a high peak luminosity, a steep decline after maximum brightness, and a short photospheric phase. To investigate the origin of these characteristics and gain insight into the progenitor and explosion properties, we carried out hydrodynamical modelling of the light curve using the open-source 1D radiation hydrodynamics code, Supernova Explosion Code (SNEC, Morozova et al. 2015). SNEC operates under local thermodynamic equilibrium (LTE) conditions and applies grey opacities, without generating spectral calculations. The code requires input parameters such as a progenitor model, explosion energy, 56Ni mass, and the degree of 56Ni mixing to produce outputs that include bolometric and multi-band light curves, as well as the evolution of photospheric velocity and temperature. To explore the influence of CSM on the light curves, CSM with varying densities and radial distributions around the progenitor can be added. This setup enables simulations of explosions within CSM environments.
Pre-supernova structure and CSM parameters for two progenitor models.
Massive stars lose significant amounts of mass during their lifetimes through various mechanisms such as line-driven winds, stable or unstable binary mass transfer, and pulsational instabilities or eruptions (e.g. Smith 2014). To capture the effects of this mass loss on the pre-SN structure and the resulting light curve, Morozova et al. (2015) used the stellar evolution code MESA (Paxton et al. 2019; Jermyn et al. 2023, and references therein) to generate a suite of pre-supernova models for a 15 M⊙ zero-age main sequence (ZAMS) star, stripped to varying degrees during the middle of the subgiant branch (mSGB) phase. This allows for the exploration of a range of hydrogen envelope masses and corresponding evolutionary outcomes. Previous hydrodynamical modelling of short-photospheric phase Type II SNe suggests that their progenitors retain significantly less hydrogen envelope mass than typical Type IIP SNe (Eldridge et al. 2018; Hiramatsu et al. 2021; Ravi et al. 2025). Therefore, given the fast-declining short photospheric phase of SN 2021tsz, we adopt the stripped-mSGB series from Morozova et al. (2015) for light curve modelling.
To determine the degree of mass stripping required to reproduce the observed decline rate of SN 2021tsz from 30 days post-explosion to tPT, we simulate explosions of progenitor models that have been stripped of 2 M⊙, 3 M⊙, and 4 M⊙ of their hydrogen envelope using SNEC. The 56Ni mass is fixed at 0.08 M⊙, as estimated in Sect. 4.2, and the outer extent of 56Ni mixing is set to a mass coordinate of 3 M⊙ as the different degrees of 56Ni mixing only has a subtle effect on the light curves (e.g. Morozova et al. 2018). The resulting bolometric light curves and photospheric velocities for an explosion energy of 1.3 × 1051 erg are shown in Fig. 8. This explosion energy is chosen because it optimally reproduces the observed photospheric velocities. The observed photospheric velocities correspond to Fe IIλ5169 velocity. The blackbody-corrected luminosity of SN 2021tsz is estimated using SuperBol (Nicholl 2018), based on BgVri photometry, and is adopted as the observed bolometric luminosity. Since the blackbody approximation generally holds until the end of the recombination phase in Type II SNe, the luminosity estimates for the last two epochs of SN 2021tsz obtained with SuperBol may be somewhat over- or underestimated. However, as these two epochs are not included in our modelling, they do not affect our analysis. The observed luminosity during the photospheric phase lies between those of the 2 M⊙ and 3 M⊙ stripped models, while the 4 M⊙ stripped model declines too rapidly compared to the observed light curve. We therefore select the 2 and 3 M⊙ stripped progenitor models for further simulation of the light curve from explosion to tPT. The pre-SN configurations for these models are listed in Table 1.
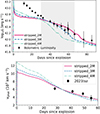 |
Fig. 8. Bolometric light curve models simulated with SNEC without CSM for 2, 3, and 4 M⊙ stripped masses and fixed explosion energy and 56Ni masses of 1.3 × 1051 erg and 0.08 M⊙, respectively, are shown along with the observed light curves in the top panel. The shaded region indicates the time frame used to constrain the extent of mass stripping in the progenitor model. In the bottom panel, the model photospheric velocities are compared to the expansion velocity of SN 2021tsz, derived from the minima of the Fe IIλ5169 absorption line. |
To model the light curve from the explosion to the end of the photospheric phase (< tPT), we attached CSM to the progenitor surface, assuming a spherical wind density profile: ρ = Kr−2, where r is the distance from the progenitor and  ) is the mass-loading parameter (with Ṁ being the mass-loss rate and vwind the wind expansion velocity). Consequently, when CSM is integrated into the model, the mass loading parameter, KCSM, and the CSM extent, RCSM, become two additional free parameters. We generated a grid of models varying the explosion energy (Eexp) from 1.0 to 2.0 foe (1 foe = 1051 erg) in increments of 0.1 foe. The mass loading parameter (KCSM) was varied from 1 to 10 × 1017 g cm−1 in intervals of 1 × 10¹⁷ g cm−1, while the CSM radius (RCSM) spanned 2000 to 4000 R⊙ in 100 R⊙ steps. To account for uncertainties in explosion time, the observed light curves were shifted by ±0.9 d in steps of 0.3 d, and this offset (toffset) was treated as a free parameter. The 56Ni mass was varied between 0.07 to 0.09 M⊙ in steps of 0.01 M⊙, with the 56Ni mixing parameter fixed at 3 M⊙.
We employed the chi-square minimisation technique to obtain the model that simultaneously best fits the observed bolometric light curve from the explosion until tPT and the observed photospheric velocity evolution. The χ2 is computed as
 (1)
(1)
where  are the observed luminosities and velocities at time t and
  correspond to the associated errors, Xλmodel(t) corresponds to the model luminosities and velocities at time t, and N is the number of observed data points.
SNEC applies bolometric corrections to derive synthetic multi-band light curves from the modelled bolometric luminosity. While these corrections are generally appropriate for normal Type II SNe, they may not reliably represent the photometric properties of fast-declining, short-photospheric phase events. Given this limitation, for SN 2021tsz we directly fit the observed bolometric light curve and expansion velocity, rather than relying on synthetic multi-band photometry, to determine the best-fit model parameters. The optimal model corresponds to a 3 M⊙ stripped progenitor, characterised by a hydrogen envelope mass of 4 M⊙, an explosion energy of 1.3 foe, a CSM radial extent of 3100 R⊙, and a mass-loading parameter of 7 × 10¹⁷ g cm−1. Fig. 9 shows the evolution of the bolometric luminosity for the best-fit model compared to the observed light curve. For reference, we also plot a model without CSM, computed with the same progenitor and explosion parameters. The lower panel shows the evolution of the photospheric velocity for both models, overlaid with the observed expansion velocities derived from Hβ and Fe IIλ5169. At velocities above 8000 km s−1, it is evident that Hβ serves as a good proxy for the photospheric velocity when the photosphere resides in the outer hydrogen-rich layers – a finding consistent with previous studies of Type IIP SNe (e.g. Takáts & Vinkó 2012).
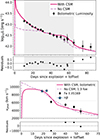 |
Fig. 9. Comparison of the observed and modelled bolometric light curve and photospheric velocity of SN 2021tsz. Top: Observed bolometric light curve alongside the best-fit SNEC model (solid line), obtained by simultaneously fitting the light curve and photospheric velocity up to 70 days. The dashed line shows the model without CSM. The shaded region indicates the fitting interval. Bottom: Model photospheric velocities plotted against observed values, derived from the minima of the Fe IIλ5169 absorption line. An explosion epoch offset of −0.9 days is applied. |
Based on the CSM parameters, the CSM mass can be written as
 (2)
(2)
where Rin is the inner CSM radius and RCSM is the outer CSM radius.
Substituting ρCSM(r) = KCSMr−2 and replacing Rin with the progenitor radius as the CSM here is assumed to be attached to the progenitor, and integrating, we get

Here, R⋆ represents the progenitor radius. From this expression, we calculate the total CSM mass to be 0.65 M⊙, using the best-fit parameter values: R⋆ = 991 R⊙, RCSM = 3100 R⊙, and KCSM = 7 × 10¹⁷ g cm−1. Such a high CSM mass was also obtained for SN 2013by (0.83 M⊙), a fast-declining Type II SN in Morozova et al. (2018). Even for other fast-declining Type II SNe, such as SNe 2013ej and 2014G, Hillier & Dessart (2019) predicted a CSM mass in the range of 0.5−1.0 M⊙, while for SN 1998S, Dessart et al. (2016) estimated a CSM mass of 0.4 M⊙. The best-fit parameters of the 2 and 3 M⊙ stripped progenitor models are summarised in Table 1. Finally, we note that the estimated values assume a symmetric ejecta–CSM configuration, although the possibility of asymmetry cannot be excluded.
While it is possible to estimate the mass-loss rate from the inferred CSM mass by assuming a reasonable wind velocity, we refrain from doing so in this work. This is because SNEC models primarily constrain the density structure of the CSM and are insensitive to the wind velocity in the pre-explosion configuration. Consequently, adopting a typical RSG wind speed of ∼10 km s−1 would imply a relatively low mass-loss rate, whereas assuming higher wind velocities (e.g. ∼100 km s−1) would yield significantly higher mass-loss rates, up to a few M⊙ yr−1, in the period shortly preceding the explosion.
7. Discussion
7.1. Diversity among short-photospheric-phase Type II SNe
To further examine the differences between fast- and slow-declining short-photospheric-phase Type II SNe, we plot V-band light curve parameters– the initial decline rate from peak (s1) versus the photospheric-phase duration (tPT)– for our comparison sample, alongside SNe II from Anderson et al. (2014a), Valenti et al. (2016), Gutiérrez et al. (2017a), Dastidar et al. (2024), and this work in Fig. 10. The points are colour-coded by the absorption-to-emission ratio of Hα at 30 days (a/e_30d)5. Since the transition from the photospheric phase to the radioactive tail is not distinct in the V band light curve of SN 2021tsz, the tPT value estimated from the r band is used here, while the decline rate is derived from the V band. Type II SNe with tPT < 90 days are labelled in the figure, and this region is shaded in grey. Squares denote events with peak absolute magnitudes in V-band (MVmax6) brighter than −18 mag, while stars (⋆) represent events with peak absolute magnitudes fainter than −18 mag. The right panel shows the s1 distribution for the subsample of SNe II with tPT < 90 days.
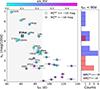 |
Fig. 10. Position of SN 2021tsz on the V-band slope (s1) vs tPT plot, alongside other SNe II. SNe II with photospheric phases shorter than 90 days are labelled, and this region is shaded in grey. SNe II with peak magnitudes fainter than −18 mag are marked with stars (⋆), while squares denote those brighter than −18 mag. The points are colour-coded by the absorption-to-emission ratio of Hα at 30 days. Data are compiled from the literature (Anderson et al. 2014a; Valenti et al. 2016; Gutiérrez et al. 2017a; Dastidar et al. 2024), along with independent estimates from this work. The right panel shows the histogram of the s1 distribution for SNe II with tPT < 90 days, where those brighter than −18 mag are shown in blue and those fainter than −18 mag in red. |
In general, slowly declining Type II SNe exhibit longer photospheric phases and higher Hα absorption-to-emission ratios than their faster-declining counterparts, consistent with earlier population studies (e.g. Gutiérrez et al. 2017a). However, the early works of Anderson et al. (2014a) and Valenti et al. (2016), featured only rare instances of short-photospheric phase events, limited to SNe 1979C, 2006Y, and 2006ai. Based on the Type II SN sample from Gutiérrez et al. (2018), the fraction of short-photospheric phase events has been estimated to be approximately ∼4% (3/78; Hiramatsu et al. 2021). Their rarity is also reflected in the models of Eldridge et al. (2018), where only 4.7% of simulated progenitors (30/637) produced short-photospheric phase Type II SN light curves. Over time, however, new discoveries have gradually built a small but growing sample, to which SN 2021tsz adds as a new member of this emerging population.
In Fig. 10, one can observe a bifurcation for tPT < 90 days into two distinct categories: slow-declining, normal luminosity SNe II (such as, SNe 2020jfo and 2018gj), and fast-declining, luminous events such as SN 2021tsz, as also noted in the recent work of Ravi et al. (2025). To explore this further, we applied a k-means clustering analysis to the subset of SNe II with plateau durations (tPT) shorter than 90 days, using a three–dimensional parameter space defined by the post-peak decline rate (s1), the Hα absorption-to-emission ratio measured at 30 days (a/e_30d), and the peak absolute magnitude in V band (MVmax). Each object is assigned to one of the clusters derived from the algorithm, and the results are visualised in Fig. 11 as a three–dimensional scatter plot with the cluster memberships distinguished by colour.
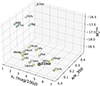 |
Fig. 11. Three-dimensional k-means clustering of the SN II sample with plateau durations (tPT) < 90 d, in the parameter space defined by the post-plateau decline rate (s1), the spectral line strength ratio (a/e_30d), and the absolute peak magnitude in V-band (MVmax). Different colours mark the two clusters identified by the algorithm, and the SN names are indicated for reference. |
The clustering analysis reveals two distinct groups. This bifurcation can be physically understood in terms of varying degrees of interaction with CSM. Stronger CSM interaction can prolong the apparent plateau duration, as densities remain high even after the recombination phase (Dessart et al. 2016). It can also increase the peak luminosity, since the ejecta–CSM shock efficiently converts kinetic energy into radiation (Chevalier & Fransson 2017). At the same time, CSM interaction tends to suppress the absorption in Hα, because shock-generated photons originating in the outer, high-velocity ejecta can fill in the Hα absorption trough (Hillier & Dessart 2019; Dessart & Hillier 2022). Thus, the observed separation of the sample into two clusters likely reflects the combined impact of CSM interaction on both the light-curve morphology and spectral line formation.
7.2. Comparison with previous modelling works
To contextualise our findings for SN 2021tsz, we compare them with previous modelling efforts on fast-declining, short-photospheric phase Type II SNe. In particular, we contrast our inferred progenitor and CSM properties with those from Hiramatsu et al. (2021) and related works, highlighting both consistencies and key differences. This helps to better understand the diversity of progenitor scenarios for such events.
SN 2021tsz exhibits a faster-declining light curve, with a luminous peak and a shorter photospheric phase compared to normal Type II SNe. Similar behaviour has been observed in Type II SNe 2006Y, 2006ai, 2016egz, and 2023ufx (Hiramatsu et al. 2021; Ravi et al. 2025), where progenitors with lower hydrogen envelope (Henv) masses were invoked to explain the light curve properties through hydrodynamical modelling. In line with these findings, Hillier & Dessart (2019) demonstrated that a 15 M⊙ progenitor with a less massive hydrogen-rich envelope could naturally reproduce such fast-declining light curves, motivating our use of stripped progenitor models from Morozova et al. (2015) in this work.
Given the low metallicity of SN 2021tsz’s host (derived from strong-line diagnostics in Sect. 3.4), strong mass loss via line-driven stellar winds would be disfavoured if RSG mass-loss rates are metallicity dependent (e.g. Vink et al. 2000, 2001; Mokiem et al. 2007; Vink & Sander 2021). Instead, binary interactions likely played a key role in stripping the progenitor’s envelope, consistent with the high binary interaction fraction (up to 70%) observed among massive stars in binary systems (Sana et al. 2012). Furthermore, population synthesis simulations by Zapartas et al. (2019) indicate that ∼30−50% of all Type II SN progenitors are expected to have interacted with a companion prior to explosion, producing progenitors with a wide range of hydrogen-envelope masses even for similar ZAMS masses.
In terms of progenitor ZAMS mass estimates, Hiramatsu et al. (2021) proposed that ZAMS masses > 17 M⊙ could give rise to short-photospheric phase SNe, especially at sub-solar metallicities (∼0.3 Z⊙) where lower opacities yield more compact progenitors with radii around 480−580 R⊙. On the other hand, Eldridge et al. (2018) suggested a broader ZAMS mass range of 7−25 M⊙ in binary evolution scenarios. In our modelling, we adopted a 15 M⊙ progenitor at solar metallicity, with envelope stripping occurring during the sub-giant branch phase. As pointed out by Dessart & Hillier (2019) and Fang et al. (2025a,b), the light curve properties are primarily governed by the hydrogen-rich envelope and provide limited constraints on the helium core or ZAMS mass. Therefore, while our modelling suggests a stripped pre-SN star, it does not allow us to precisely constrain the progenitor’s initial mass.
We find a pre-SN hydrogen envelope mass of ∼4 M⊙ corresponding to the 3 M⊙ H-stripped model, which is higher than the 0.91−2.12 M⊙ range estimated by Hiramatsu et al. (2021). This discrepancy likely arises from structural differences in the progenitor models: Hiramatsu et al. (2021) assumed more compact progenitors, whereas we adopted an extended progenitor structure. Since the photospheric luminosity depends on the envelope’s density profile, compact progenitors require smaller envelope masses compared to extended ones to produce similar observed light curve features. Consequently, the pre-SN mass inferred by Hiramatsu et al. (2021) (7.1−8.5 M⊙) is also somewhat lower than that estimated for SN 2021tsz in this work (9.2 M⊙), although the helium core masses are comparable (5.1 M⊙ in this work and 5.4−6.9 M⊙ in Hiramatsu et al. 2021). Thus, adopting a solar-metallicity progenitor in this work, despite the host’s lower metallicity, may partly explain the higher pre-SN hydrogen envelope mass inferred here.
The CSM mass required to explain the early light curve excess in SN 2021tsz is higher than that inferred for the events studied by Hiramatsu et al. (2021) (0.1−0.3 M⊙), which had early excesses lasting only ∼10 days. In contrast, SN 2021tsz exhibited a much brighter and more prolonged early excess (∼30 days), necessitating a denser and more massive CSM. Assuming a standard RSG wind velocity (10 km s−1), this material would have been ejected ∼4.6 years before core collapse, while a faster ‘super-wind’ (100 km s−1; e.g. Smith et al. 2023) would place the onset within ∼6 months of explosion.
Our modelling thus indicates the presence of a dense CSM close to the progenitor, likely formed during the final evolutionary stages. While binary interactions remain the most plausible channel for producing such a dense environment, Zapartas et al. (2019) argued that binary interactions occurring shortly before core collapse are statistically rare unless triggered by late-stage stellar instabilities, such as envelope inflation induced by nuclear burning instabilities (e.g. Mcley & Soker 2014; Smith 2014) or wave-driven mass loss (e.g. Fuller 2017). Such instabilities could also independently drive CSM formation in single-star progenitors. Alternatively, colliding winds in close binaries could also generate dense boundary layers that mimic mass loss from single stars (Kochanek 2019). The precise origin of the CSM in SN 2021tsz, therefore, remains uncertain, but it most likely reflects a complex interplay between binary evolution and late-stage stellar instabilities. Finally, we note the absence of narrow emission lines in our spectra, despite evidence of a dense, nearby CSM. Such features may have disappeared within the first week, when no spectroscopy was obtained. Alternatively, in high-density environments (as inferred here), the mean free path of recombination photons that would normally produce IIn-like narrow lines can be much smaller than the CSM’s radial extent (Dessart et al. 2017), thereby suppressing their appearance in this event.
8. Summary
With the advent of untargeted surveys, an increasing number of SNe are being discovered in low-luminosity, dwarf galaxies (e.g. Gutiérrez et al. 2018). We present the analysis of one such event, SN 2021tsz, a luminous, fast-declining Type II SN. It reaches a peak absolute magnitude of −18.88 mag in the r-band and exhibits a rapid decline of 4.0 mag (100 d)−1. The photospheric phase is notably short, lasting about 63 days, followed by a 0.97 mag drop to the radioactive decay tail in the r-band. The host galaxy, determined through SED analysis and strong-line diagnostics, is a low-metallicity dwarf galaxy (M⋆ = 1.2 × 10⁸ M⊙, Z = 0.3 Z⊙).
Spectroscopically, SN 2021tsz shows a Hα profile with a weak absorption component, indicative of strong CSM interaction (Hillier & Dessart 2019), and consistent with brighter, faster-declining Type II SNe (Gutiérrez et al. 2014). Fe II features appear from 28 days onwards, while earlier spectra are dominated by a blue continuum, likely due to interaction. The spectroscopic properties of SN 2021tsz resemble those of other fast-declining short photospheric phase Type II SNe, whereas slow-declining events display stronger hydrogen and metal absorption lines. Our clustering analysis shows that these groups are separated in a three dimensional parameter space defined by decline rate from peak, Hα absorption-to-emission ratio at 30 d after explosion, and V-band peak absolute magnitude, which we interpret as arising from different degrees of CSM interaction.
Hydrodynamical modelling of the light curve indicates that CSM interaction dominates the luminosity during the first 30 days. To reproduce the short photospheric phase, partially stripped pre-SN models are used. Considering the host’s low metallicity, strong winds would be unlikely, and binary interactions are a more probable cause of the stripping. The modelling also points to late-stage mass loss forming a dense shell near the progenitor, potentially arising from nuclear burning instabilities or radiatively cooled boundary layers formed by colliding winds in a binary system. The best-fit model suggests a pre-SN configuration with a hydrogen envelope mass of 4 M⊙, surrounded by compact, dense CSM extending up to ∼3100 R⊙, with a total CSM mass of 0.6 M⊙. The explosion energy required to reproduce the photospheric phase luminosity and velocity is 1.3 × 1051 erg.
The low-metallicity environment and the derived high CSM mass from hydrodynamical modelling strongly support a binary progenitor system for SN 2021tsz. The degree of envelope stripping implied by its short photospheric phase and light curve evolution is difficult to achieve through single-star evolution, especially at low metallicity where line-driven winds are weak. Binary interaction thus emerges as the most likely mechanism responsible for the reduced hydrogen envelope mass. Furthermore, the scarcity of such events suggests that the conditions required for their formation are rare. If binary evolution is indeed the dominant channel, it more often leads to progenitors with even lower hydrogen envelope masses, favouring the production of SNe IIb instead. This could naturally explain the rarity of short-photospheric phase Type II SN. In this context, SN 2021tsz represents a transitional case, bridging the gap between classical Type IIP and stripped-envelope Type IIb explosions.
Data availability
All spectra are publicly available7 on the WISeREP interface (Yaron & Gal-Yam 2012).
Publicly available from http://cosmicflows.iap.fr
This parameter is defined as the ratio of the pseudo–equivalent widths of the absorption to emission components of Hα at 30 days, where the pseudo-continuum is determined as a straight line connecting the continuum regions around Hα.
In some events, the peak was not observed; in those cases, we use the brightest observed magnitude as MVmax.
Acknowledgments
We express our gratitude to the anonymous referee for providing us with valuable suggestions and scientific insights that enhanced the quality of the paper. This work makes use of data from the Las Cumbres Observatory global network of telescopes. The LCO group is supported by NSF grants AST-1911151 and AST-1911225. G.P. acknowledges support from the National Agency for Research and Development (ANID) through the Millennium Science Initiative Program – ICN12_009. M.S. acknowledges financial support provided under the National Post Doctoral Fellowship (N-PDF; File Number: PDF/2023/002244) by the Science & Engineering Research Board (SERB), Anusandhan National Research Foundation (ANRF), Government of India. C.P.G. acknowledges financial support from the Secretary of Universities and Research (Government of Catalonia) and by the Horizon 2020 Research and Innovation Programme of the European Union under the Marie Skłodowska-Curie and the Beatriu de Pinós 2021 BP 00168 programme, from the Spanish Ministerio de Ciencia e Innovación (MCIN) and the Agencia Estatal de Investigación (AEI) 10.13039/501100011033 under the PID2023-151307NB-I00 SNNEXT project, from Centro Superior de Investigaciones Científicas (CSIC) under the PIE project 20215AT016 and the program Unidad de Excelencia María de Maeztu CEX2020-001058-M, and from the Departament de Recerca i Universitats de la Generalitat de Catalunya through the 2021-SGR-01270 grant. AK is supported by the UK Science and Technology Facilities Council (STFC) Consolidated grant ST/V000853/1. We acknowledge Wiezmann Interactive Supernova data REPository http://wiserep.weizmann.ac.il (WISeREP, Yaron & Gal-Yam 2012). This research has made use of the NASA/IPAC Extragalactic Database (NED), which is operated by the Jet Propulsion Laboratory, California Institute of Technology, under contract with the National Aeronautics and Space Administration.
References
- Ailawadhi, B., Dastidar, R., Misra, K., et al. 2023, MNRAS, 519, 248 [NASA ADS] [Google Scholar]
- Anderson, J. P. 2019, A&A, 628, A7 [NASA ADS] [CrossRef] [EDP Sciences] [Google Scholar]
- Anderson, J. P., González-Gaitán, S., Hamuy, M., et al. 2014a, ApJ, 786, 67 [Google Scholar]
- Anderson, J. P., Dessart, L., Gutierrez, C. P., et al. 2014b, MNRAS, 441, 671 [NASA ADS] [CrossRef] [Google Scholar]
- Anderson, J. P., Gutiérrez, C. P., Dessart, L., et al. 2016, A&A, 589, A110 [NASA ADS] [CrossRef] [EDP Sciences] [Google Scholar]
- Andrews, J. E., Shrestha, M., Bostroem, K. A., et al. 2025, ApJ, 980, 37 [Google Scholar]
- Arcavi, I., Gal-Yam, A., Cenko, S. B., et al. 2012, ApJ, 756, L30 [NASA ADS] [CrossRef] [Google Scholar]
- Arcavi, I., Gal-Yam, A., Sullivan, M., et al. 2014, ApJ, 793, 38 [Google Scholar]
- Baldwin, J. A., Phillips, M. M., & Terlevich, R. 1981, PASP, 93, 5 [Google Scholar]
- Balinskaia, I. S., Bychkov, K. V., & Neizvestnyi, S. I. 1980, A&A, 85, L19 [Google Scholar]
- Barbon, R., Ciatti, F., & Rosino, L. 1979, A&A, 72, 287 [Google Scholar]
- Barbon, R., Ciatti, F., & Rosino, L. 1982a, A&A, 116, 35 [NASA ADS] [Google Scholar]
- Barbon, R., Ciatti, F., Rosino, L., Ortolani, S., & Rafanelli, P. 1982b, A&A, 116, 43 [Google Scholar]
- Bell, E. F., McIntosh, D. H., Katz, N., & Weinberg, M. D. 2003, ApJS, 149, 289 [Google Scholar]
- Bellm, E. C., Kulkarni, S. R., Graham, M. J., et al. 2019, PASP, 131, 018002 [Google Scholar]
- Blinnikov, S. I., & Bartunov, O. S. 1993, A&A, 273, 106 [NASA ADS] [Google Scholar]
- Boquien, M., Burgarella, D., Roehlly, Y., et al. 2019, A&A, 622, A103 [NASA ADS] [CrossRef] [EDP Sciences] [Google Scholar]
- Bose, S., Kumar, B., Misra, K., et al. 2016, MNRAS, 455, 2712 [NASA ADS] [CrossRef] [Google Scholar]
- Bothwell, M. S., Kennicutt, R. C., & Lee, J. C. 2009, MNRAS, 400, 154 [Google Scholar]
- Branch, D., Falk, S. W., McCall, M. L., et al. 1981, ApJ, 244, 780 [Google Scholar]
- Brown, T. M., Baliber, N., Bianco, F. B., et al. 2013, PASP, 125, 1031 [Google Scholar]
- Bruch, R. J., Gal-Yam, A., Schulze, S., et al. 2021, ApJ, 912, 46 [NASA ADS] [CrossRef] [Google Scholar]
- Bruch, R. J., Gal-Yam, A., Yaron, O., et al. 2023, ApJ, 952, 119 [NASA ADS] [CrossRef] [Google Scholar]
- Bruzual, G., & Charlot, S. 2003, MNRAS, 344, 1000 [NASA ADS] [CrossRef] [Google Scholar]
- Buta, R. J. 1982, PASP, 94, 578 [CrossRef] [Google Scholar]
- Calzetti, D., Armus, L., Bohlin, R. C., et al. 2000, ApJ, 533, 682 [NASA ADS] [CrossRef] [Google Scholar]
- Carrasco-Davis, R., Reyes, E., Valenzuela, C., et al. 2021, AJ, 162, 231 [NASA ADS] [CrossRef] [Google Scholar]
- Carrick, J., Turnbull, S. J., Lavaux, G., & Hudson, M. J. 2015, MNRAS, 450, 317 [Google Scholar]
- Chabrier, G. 2003, PASP, 115, 763 [Google Scholar]
- Chevalier, R. A., & Fransson, C. 1994, ApJ, 420, 268 [NASA ADS] [CrossRef] [Google Scholar]
- Chevalier, R. A., & Fransson, C. 2017, in Handbook of Supernovae, eds. A. W. Alsabti, & P. Murdin, 875 [Google Scholar]
- Chugai, N. N. 1988, Soviet Astron. Lett., 14, 334 [Google Scholar]
- Cleveland, W. S. 1979, J. Am. Stat. Assoc., 74, 829 [Google Scholar]
- Dale, D. A., Helou, G., Magdis, G. E., et al. 2014, ApJ, 784, 83 [Google Scholar]
- Das, K. K., Kasliwal, M. M., Fremling, C., et al. 2023, ApJ, 959, 12 [CrossRef] [Google Scholar]
- Dastidar, R., Pignata, G., Dukiya, N., et al. 2024, A&A, 685, A44 [NASA ADS] [CrossRef] [EDP Sciences] [Google Scholar]
- de Jaeger, T., Anderson, J. P., Galbany, L., et al. 2018, MNRAS, 476, 4592 [NASA ADS] [CrossRef] [Google Scholar]
- de Vaucouleurs, G., de Vaucouleurs, A., Buta, R., Ables, H. D., & Hewitt, A. V. 1981, PASP, 93, 36 [NASA ADS] [CrossRef] [Google Scholar]
- Dessart, L., & Hillier, D. J. 2005, A&A, 437, 667 [NASA ADS] [CrossRef] [EDP Sciences] [Google Scholar]
- Dessart, L., & Hillier, D. J. 2019, A&A, 625, A9 [NASA ADS] [CrossRef] [EDP Sciences] [Google Scholar]
- Dessart, L., & Hillier, D. J. 2022, A&A, 660, L9 [NASA ADS] [CrossRef] [EDP Sciences] [Google Scholar]
- Dessart, L., Hillier, D. J., Waldman, R., & Livne, E. 2013, MNRAS, 433, 1745 [NASA ADS] [CrossRef] [Google Scholar]
- Dessart, L., Gutierrez, C. P., Hamuy, M., et al. 2014, MNRAS, 440, 1856 [NASA ADS] [CrossRef] [Google Scholar]
- Dessart, L., Hillier, D. J., Audit, E., Livne, E., & Waldman, R. 2016, MNRAS, 458, 2094 [Google Scholar]
- Dessart, L., Hillier, D. J., & Audit, E. 2017, A&A, 605, A83 [NASA ADS] [CrossRef] [EDP Sciences] [Google Scholar]
- Dressler, A., Bigelow, B., Hare, T., et al. 2011, PASP, 123, 288 [NASA ADS] [CrossRef] [Google Scholar]
- Ekström, S., Georgy, C., Eggenberger, P., et al. 2012, A&A, 537, A146 [Google Scholar]
- Eldridge, J. J., Stanway, E. R., Xiao, L., et al. 2017, PASA, 34, e058 [Google Scholar]
- Eldridge, J. J., Xiao, L., Stanway, E. R., Rodrigues, N., & Guo, N. Y. 2018, PASA, 35, e049 [NASA ADS] [CrossRef] [Google Scholar]
- Elias-Rosa, N., Van Dyk, S. D., Li, W., et al. 2010, ApJ, 714, L254 [Google Scholar]
- Fang, Q., Maeda, K., Ye, H., Moriya, T. J., & Matsumoto, T. 2025a, ApJ, 978, 35 [Google Scholar]
- Fang, Q., Moriya, T. J., Maeda, K., Dorozsmai, A., & Silva-Farfán, J. 2025b, ApJ, 990, 60 [Google Scholar]
- Faran, T., Poznanski, D., Filippenko, A. V., et al. 2014, MNRAS, 445, 554 [NASA ADS] [CrossRef] [Google Scholar]
- Filippenko, A. V. 1988, AJ, 96, 1941 [CrossRef] [Google Scholar]
- Förster, F., Cabrera-Vives, G., Castillo-Navarrete, E., et al. 2021, AJ, 161, 242 [CrossRef] [Google Scholar]
- Fraser, M., Takáts, K., Pastorello, A., et al. 2010, ApJ, 714, L280 [Google Scholar]
- Fuller, J. 2017, MNRAS, 470, 1642 [NASA ADS] [CrossRef] [Google Scholar]
- Gall, E. E. E., Polshaw, J., Kotak, R., et al. 2015, A&A, 582, A3 [NASA ADS] [CrossRef] [EDP Sciences] [Google Scholar]
- Gal-Yam, A. 2012, Science, 337, 927 [Google Scholar]
- Gal-Yam, A., Arcavi, I., Ofek, E. O., et al. 2014, Nature, 509, 471 [CrossRef] [Google Scholar]
- Gogarten, S. M., Dalcanton, J. J., Williams, B. F., et al. 2009, ApJ, 691, 115 [Google Scholar]
- González-Gaitán, S., Tominaga, N., Molina, J., et al. 2015, MNRAS, 451, 2212 [CrossRef] [Google Scholar]
- Graur, O., Bianco, F. B., Modjaz, M., et al. 2017, ApJ, 837, 121 [CrossRef] [Google Scholar]
- Grayling, M., Gutiérrez, C. P., Sullivan, M., et al. 2023, MNRAS, 520, 684 [CrossRef] [Google Scholar]
- Guevel, D., & Hosseinzadeh, G. 2017, https://doi.org/10.5281/zenodo.1043973 [Google Scholar]
- Gutiérrez, C. P., Anderson, J. P., Hamuy, M., et al. 2014, ApJ, 786, L15 [CrossRef] [Google Scholar]
- Gutiérrez, C. P., Anderson, J. P., Hamuy, M., et al. 2017a, ApJ, 850, 89 [CrossRef] [Google Scholar]
- Gutiérrez, C. P., Anderson, J. P., Hamuy, M., et al. 2017b, ApJ, 850, 90 [CrossRef] [Google Scholar]
- Gutiérrez, C. P., Anderson, J. P., Sullivan, M., et al. 2018, MNRAS, 479, 3232 [CrossRef] [Google Scholar]
- Hamuy, M. 2003, ApJ, 582, 905 [NASA ADS] [CrossRef] [Google Scholar]
- Heger, A., Fryer, C. L., Woosley, S. E., Langer, N., & Hartmann, D. H. 2003, ApJ, 591, 288 [CrossRef] [Google Scholar]
- Helou, G., Madore, B. F., Schmitz, M., et al. 1991, Astrophys. Space Sci. Lib., 171, 89 [CrossRef] [Google Scholar]
- Henden, A. A., Templeton, M., Terrell, D., et al. 2016, VizieR Online Data Catalog: II/336 [Google Scholar]
- Hernández-García, L., Panessa, F., Bruni, G., et al. 2023, MNRAS, 525, 2187 [CrossRef] [Google Scholar]
- Hillier, D. J., & Dessart, L. 2019, A&A, 631, A8 [NASA ADS] [CrossRef] [EDP Sciences] [Google Scholar]
- Hiramatsu, D., Howell, D. A., Moriya, T. J., et al. 2021, ApJ, 913, 55 [CrossRef] [Google Scholar]
- Hiramatsu, D., Berger, E., Gomez, S., et al. 2024, ArXiv e-prints [arXiv:2411.07287] [Google Scholar]
- Hosseinzadeh, G., & Gomez, S. 2022, https://doi.org/10.5281/zenodo.6519623 [Google Scholar]
- Huang, S., Haynes, M. P., Giovanelli, R., et al. 2012, AJ, 143, 133 [NASA ADS] [CrossRef] [Google Scholar]
- Ibeling, D., & Heger, A. 2013, ApJ, 765, L43 [NASA ADS] [CrossRef] [Google Scholar]
- Inserra, C., Smartt, S. J., Gall, E. E. E., et al. 2018, MNRAS, 475, 1046 [NASA ADS] [CrossRef] [Google Scholar]
- Jacobson-Galán, W. V., Dessart, L., Davis, K. W., et al. 2024, ApJ, 970, 189 [CrossRef] [Google Scholar]
- Jeffery, D. J., & Branch, D. 1990, in Supernovae, Jerusalem Winter School for Theoretical Physics, eds. J. C. Wheeler, T. Piran, & S. Weinberg, 6, 149 [NASA ADS] [Google Scholar]
- Jermyn, A. S., Bauer, E. B., Schwab, J., et al. 2023, ApJS, 265, 15 [NASA ADS] [CrossRef] [Google Scholar]
- Jiang, N., Moon, D.-S., Ni, Y. Q., et al. 2025, ApJ, 989, 53 [Google Scholar]
- Karachentsev, I. D., & Kaisina, E. I. 2013, AJ, 146, 46 [NASA ADS] [CrossRef] [Google Scholar]
- Kasen, D. 2017, in Handbook of Supernovae, eds. A. W. Alsabti, & P. Murdin, 939 [Google Scholar]
- Kennicutt, R. C. 1998, ARA&A, 36, 189 [NASA ADS] [CrossRef] [Google Scholar]
- Khazov, D., Yaron, O., Gal-Yam, A., et al. 2016, ApJ, 818, 3 [CrossRef] [Google Scholar]
- Kiewe, M., Gal-Yam, A., Arcavi, I., et al. 2012, ApJ, 744, 10 [NASA ADS] [CrossRef] [Google Scholar]
- Kochanek, C. S. 2019, MNRAS, 483, 3762 [Google Scholar]
- Law, N. M., Kulkarni, S. R., Dekany, R. G., et al. 2009, PASP, 121, 1395 [NASA ADS] [CrossRef] [Google Scholar]
- Li, W., Leaman, J., Chornock, R., et al. 2011, MNRAS, 412, 1441 [NASA ADS] [CrossRef] [Google Scholar]
- Madau, P., & Dickinson, M. 2014, ARA&A, 52, 415 [Google Scholar]
- Maraston, C., Hill, L., Thomas, D., et al. 2020, MNRAS, 496, 2962 [Google Scholar]
- Marino, R. A., Rosales-Ortega, F. F., Sánchez, S. F., et al. 2013, A&A, 559, A114 [NASA ADS] [CrossRef] [EDP Sciences] [Google Scholar]
- Martinez, L., Anderson, J. P., Bersten, M. C., et al. 2022, A&A, 660, A42 [NASA ADS] [CrossRef] [EDP Sciences] [Google Scholar]
- Masci, F. J., Laher, R. R., Rusholme, B., et al. 2019, PASP, 131, 018003 [Google Scholar]
- Masci, F. J., Laher, R. R., Rusholme, B., et al. 2023, ArXiv e-prints [arXiv:2305.16279] [Google Scholar]
- Maund, J. R., Reilly, E., & Mattila, S. 2014, MNRAS, 438, 938 [NASA ADS] [CrossRef] [Google Scholar]
- Maund, J. R., Fraser, M., Reilly, E., Ergon, M., & Mattila, S. 2015, MNRAS, 447, 3207 [CrossRef] [Google Scholar]
- McCully, C., Volgenau, N. H., Harbeck, D.-R., et al. 2018, SPIE Conf. Ser., 10707, 107070K [Google Scholar]
- Mcley, L., & Soker, N. 2014, MNRAS, 445, 2492 [CrossRef] [Google Scholar]
- Modjaz, M., Gutiérrez, C. P., & Arcavi, I. 2019, Nat. Astron., 3, 717 [NASA ADS] [CrossRef] [Google Scholar]
- Mokiem, M. R., de Koter, A., Vink, J. S., et al. 2007, A&A, 473, 603 [NASA ADS] [CrossRef] [EDP Sciences] [Google Scholar]
- Morozova, V., Piro, A. L., Renzo, M., et al. 2015, ApJ, 814, 63 [Google Scholar]
- Morozova, V., Piro, A. L., & Valenti, S. 2017, ApJ, 838, 28 [NASA ADS] [CrossRef] [Google Scholar]
- Morozova, V., Piro, A. L., & Valenti, S. 2018, ApJ, 858, 15 [Google Scholar]
- Müller, T., Prieto, J. L., Pejcha, O., & Clocchiatti, A. 2017, ApJ, 841, 127 [Google Scholar]
- Munoz-Arancibia, A., Forster, F., Bauer, F. E., et al. 2021, Transient Name Server Discovery Report, 2021-2496, 1 [Google Scholar]
- Neumann, J., Thomas, D., Maraston, C., et al. 2022, MNRAS, 513, 5988 [NASA ADS] [Google Scholar]
- Nicholl, M. 2018, Res. Notes Am. Astron. Soc., 2, 230 [NASA ADS] [Google Scholar]
- Nyholm, A., Sollerman, J., Tartaglia, L., et al. 2020, A&A, 637, A73 [NASA ADS] [CrossRef] [EDP Sciences] [Google Scholar]
- Olivares, E. F., Hamuy, M., Pignata, G., et al. 2010, ApJ, 715, 833 [NASA ADS] [CrossRef] [Google Scholar]
- Orellana, M., Bersten, M. C., & Moriya, T. J. 2018, A&A, 619, A145 [NASA ADS] [CrossRef] [EDP Sciences] [Google Scholar]
- Patat, F., Barbon, R., Cappellaro, E., & Turatto, M. 1994, A&A, 282, 731 [NASA ADS] [Google Scholar]
- Paxton, B., Smolec, R., Schwab, J., et al. 2019, ApJS, 243, 10 [Google Scholar]
- Pessi, P. J., Gromadski, M., & Strotjohann, N. L. 2021, Transient Name Server Classification Report, 2021-2659, 1 [Google Scholar]
- Pessi, P. J., Anderson, J. P., Folatelli, G., et al. 2023, MNRAS, 523, 5315 [NASA ADS] [CrossRef] [Google Scholar]
- Planck Collaboration VI. 2020, A&A, 641, A6 [NASA ADS] [CrossRef] [EDP Sciences] [Google Scholar]
- Rau, A., Kulkarni, S. R., Law, N. M., et al. 2009, PASP, 121, 1334 [NASA ADS] [CrossRef] [Google Scholar]
- Ravi, A. P., Valenti, S., Dong, Y., et al. 2025, ApJ, 982, 12 [Google Scholar]
- Rodríguez, Ó., Meza, N., Pineda-García, J., & Ramirez, M. 2021, MNRAS, 505, 1742 [CrossRef] [Google Scholar]
- Rubin, A., & Gal-Yam, A. 2016, ApJ, 828, 111 [NASA ADS] [CrossRef] [Google Scholar]
- Rubin, A., Gal-Yam, A., De Cia, A., et al. 2016, ApJ, 820, 33 [NASA ADS] [CrossRef] [Google Scholar]
- Sana, H., de Mink, S. E., de Koter, A., et al. 2012, Science, 337, 444 [Google Scholar]
- Sanders, N. E., Soderberg, A. M., Gezari, S., et al. 2015, ApJ, 799, 208 [NASA ADS] [CrossRef] [Google Scholar]
- Schlafly, E. F., & Finkbeiner, D. P. 2011, ApJ, 737, 103 [Google Scholar]
- Schlegel, E. M. 1990, MNRAS, 244, 269 [NASA ADS] [Google Scholar]
- Schlegel, E. M. 1996, AJ, 111, 1660 [NASA ADS] [CrossRef] [Google Scholar]
- Seibert, M., Wyder, T., Neill, J., et al. 2012, Am. Astron. Soc. Meet. Abstr., 219, 340.01 [Google Scholar]
- Shingles, L., Smith, K. W., Young, D. R., et al. 2021, Transient Name Server AstroNote, 7, 1 [NASA ADS] [Google Scholar]
- Shivvers, I., Modjaz, M., Zheng, W., et al. 2017, PASP, 129, 054201 [NASA ADS] [CrossRef] [Google Scholar]
- Silva-Farfán, J., Förster, F., Moriya, T. J., et al. 2024, ApJ, 969, 57 [Google Scholar]
- Smartt, S. J. 2015, PASA, 32, e016 [NASA ADS] [CrossRef] [Google Scholar]
- Smartt, S. J., Eldridge, J. J., Crockett, R. M., & Maund, J. R. 2009, MNRAS, 395, 1409 [CrossRef] [Google Scholar]
- Smartt, S. J., Valenti, S., Fraser, M., et al. 2015, A&A, 579, A40 [NASA ADS] [CrossRef] [EDP Sciences] [Google Scholar]
- Smith, N. 2014, ARA&A, 52, 487 [NASA ADS] [CrossRef] [Google Scholar]
- Smith, K. W., Smartt, S. J., Young, D. R., et al. 2020, PASP, 132, 085002 [Google Scholar]
- Smith, N., Pearson, J., Sand, D. J., et al. 2023, ApJ, 956, 46 [NASA ADS] [CrossRef] [Google Scholar]
- Sollerman, J., Yang, S., Schulze, S., et al. 2021, A&A, 655, A105 [NASA ADS] [CrossRef] [EDP Sciences] [Google Scholar]
- Stetson, P. B. 1987, PASP, 99, 191 [Google Scholar]
- Taddia, F., Stritzinger, M. D., Sollerman, J., et al. 2013, A&A, 555, A10 [NASA ADS] [CrossRef] [EDP Sciences] [Google Scholar]
- Taddia, F., Moquist, P., Sollerman, J., et al. 2016, A&A, 587, L7 [NASA ADS] [CrossRef] [EDP Sciences] [Google Scholar]
- Takáts, K., & Vinkó, J. 2012, MNRAS, 419, 2783 [CrossRef] [Google Scholar]
- Tartaglia, L., Sand, D. J., Groh, J. H., et al. 2021, ApJ, 907, 52 [NASA ADS] [CrossRef] [Google Scholar]
- Tartaglia, L., Valerin, G., Pastorello, A., et al. 2024, arXiv e-prints [arXiv:2409.15431] [Google Scholar]
- Teja, R. S., Singh, A., Sahu, D. K., et al. 2022, ApJ, 930, 34 [NASA ADS] [CrossRef] [Google Scholar]
- Teja, R. S., Singh, A., Sahu, D. K., et al. 2023, ApJ, 954, 155 [Google Scholar]
- Terreran, G., Jerkstrand, A., Benetti, S., et al. 2016, MNRAS, 462, 137 [Google Scholar]
- Tonry, J. L., Denneau, L., Heinze, A. N., et al. 2018, PASP, 130, 064505 [Google Scholar]
- Tsvetkov, D. Y. 1983, Peremennye Zvezdy, 22, 39 [Google Scholar]
- Tucker, M. A., Hinkle, J., Angus, C. R., et al. 2024, ApJ, 976, 178 [Google Scholar]
- Valenti, S., Howell, D. A., Stritzinger, M. D., et al. 2016, MNRAS, 459, 3939 [NASA ADS] [CrossRef] [Google Scholar]
- Van Dyk, S. D. 2017, Phil. Trans. Roy. Soc. London Ser. A, 375, 20160277 [Google Scholar]
- van Dyk, S. D., Peng, C. Y., Barth, A. J., et al. 1999, PASP, 111, 313 [Google Scholar]
- Vink, J. S., & Sander, A. A. C. 2021, MNRAS, 504, 2051 [NASA ADS] [CrossRef] [Google Scholar]
- Vink, J. S., de Koter, A., & Lamers, H. J. G. L. M. 2000, A&A, 362, 295 [Google Scholar]
- Vink, J. S., de Koter, A., & Lamers, H. J. G. L. M. 2001, A&A, 369, 574 [NASA ADS] [CrossRef] [EDP Sciences] [Google Scholar]
- Wilkinson, D. M., Maraston, C., Goddard, D., Thomas, D., & Parikh, T. 2017, MNRAS, 472, 4297 [Google Scholar]
- Wright, E. L., Eisenhardt, P. R. M., Mainzer, A. K., et al. 2010, AJ, 140, 1868 [Google Scholar]
- Yaron, O., & Gal-Yam, A. 2012, PASP, 124, 668 [Google Scholar]
- Zackay, B., Ofek, E. O., & Gal-Yam, A. 2016, ApJ, 830, 27 [NASA ADS] [CrossRef] [Google Scholar]
- Zapartas, E., de Mink, S. E., Justham, S., et al. 2019, A&A, 631, A5 [NASA ADS] [CrossRef] [EDP Sciences] [Google Scholar]
- Zhang, X., Wang, X., Sai, H., et al. 2022, MNRAS, 509, 2013 [Google Scholar]
Appendix A: Additional tables and figures
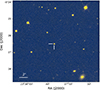 |
Fig. A.1. Two-hundred second r-band image of the SN field obtained with the 1 m LCO telescope on 2021 July 30. The location of SN 2021tsz in the low-luminosity host galaxy SDSS J233758.39–002629.6 is marked. The SN is located very close to the galaxy nucleus–0.12″ S and 0.00″ W of the centre. As the host is a low-luminosity dwarf galaxy, the SN outshines it during the early phases, and only the SN is visible in this image. |
Basic information of SN 2021tsz and its host galaxy.
Log of spectroscopic observations.
ZTF g, r and i band forced photometry of SN 2021tsz.
Magnitudes of SN 2021tsz in BVgri filters. The BV-band photometry are given in Vega magnitudes and gri-band data are presented in AB magnitudes.
ATLAS o and c band forced photometry of SN 2021tsz.
Light curve slopes in different phases.
Type II SNe comparison sample.
Light curve parameters of SN 2021tsz and the comparison sample in V-band.
All Tables
Magnitudes of SN 2021tsz in BVgri filters. The BV-band photometry are given in Vega magnitudes and gri-band data are presented in AB magnitudes.
All Figures
|
Fig. 1. Top panel: Spectrum of the host galaxy SDSS J233758.39−002629.6 of SN 2021tsz, overlaid with the best-fit stellar continuum model obtained using FIREFLY. Prominent emission lines, including Hα, Hβ, [O III] λλ4959,5007, and [N II] λ6583, are marked. Bottom panel: Host galaxy spectrum after subtraction of the stellar continuum model, highlighting the nebular emission lines used for redshift, SFR, and metallicity diagnostics. |
| In the text | |
|
Fig. 2. BgVri, ZTF gri, and ATLAS c, o-band light curves of SN 2021tsz offset by values as shown in the legend. ZTF gri magnitudes are in the SDSS photometric system. The absolute magnitudes are corrected for distance and reddening as listed in Table A.1. Parametrised fit to the r and i band light curves are also shown (Olivares et al. 2010). The vertical grey lines denote the epochs at which a spectrum of SN 2021tsz was obtained. |
| In the text | |
|
Fig. 3. B − V colour curve of SN 2021tsz compared to those of the comparison sample SNe. The colour of SN 2021tsz and the comparison sample are extinction corrected. Prior to estimating the colour, LOESS regression was applied to smooth out the B and V band light curves of all SNe. In the background, the unreddened sub-sample of 19 SNe II from de Jaeger et al. (2018) is shown in blue, while the rest of the sample SNe with extinction correction applied are shown in pink. |
| In the text | |
|
Fig. 4. Comparison of absolute r band light curve of SN 2021tsz with those of the comparison sample. The magnitudes have been corrected for distance and reddening as listed in Table A.7. |
| In the text | |
|
Fig. 5. Spectral evolution of SN 2021tsz from 8.0 to 61.0 days after explosion, with prominent lines marked. Right panel: Evolution of the Hα profile in velocity space (centred at the rest wavelength of Hα) for spectra with S/N > 5. The broad component is shown after subtraction of the narrow Gaussian (FWHM ∼ 10 Å) with its best-fit profile overplotted with black dashed lines. The corresponding narrow component, attributed to the host galaxy, is indicated by grey dashed lines. |
| In the text | |
|
Fig. 6. Comparison of 48.9 day spectrum of SN 2021tsz with similar epoch spectra of the comparison sample corrected for both redshift and reddening. On the right, a cut-out of the Hα region is shown in the velocity space, centred at the rest wavelength of Hα. |
| In the text | |
|
Fig. 7. Expansion velocity of SN 2021tsz is shown along with that of the comparison sample SNe and the mean velocity (grey) of 122 IIP/IIL SNe (Gutiérrez et al. 2017a) for Hβ (top panel) and Fe IIλ5169 (bottom panel). The light grey regions represent the standard deviations of the mean velocities of the sample. |
| In the text | |
|
Fig. 8. Bolometric light curve models simulated with SNEC without CSM for 2, 3, and 4 M⊙ stripped masses and fixed explosion energy and 56Ni masses of 1.3 × 1051 erg and 0.08 M⊙, respectively, are shown along with the observed light curves in the top panel. The shaded region indicates the time frame used to constrain the extent of mass stripping in the progenitor model. In the bottom panel, the model photospheric velocities are compared to the expansion velocity of SN 2021tsz, derived from the minima of the Fe IIλ5169 absorption line. |
| In the text | |
|
Fig. 9. Comparison of the observed and modelled bolometric light curve and photospheric velocity of SN 2021tsz. Top: Observed bolometric light curve alongside the best-fit SNEC model (solid line), obtained by simultaneously fitting the light curve and photospheric velocity up to 70 days. The dashed line shows the model without CSM. The shaded region indicates the fitting interval. Bottom: Model photospheric velocities plotted against observed values, derived from the minima of the Fe IIλ5169 absorption line. An explosion epoch offset of −0.9 days is applied. |
| In the text | |
|
Fig. 10. Position of SN 2021tsz on the V-band slope (s1) vs tPT plot, alongside other SNe II. SNe II with photospheric phases shorter than 90 days are labelled, and this region is shaded in grey. SNe II with peak magnitudes fainter than −18 mag are marked with stars (⋆), while squares denote those brighter than −18 mag. The points are colour-coded by the absorption-to-emission ratio of Hα at 30 days. Data are compiled from the literature (Anderson et al. 2014a; Valenti et al. 2016; Gutiérrez et al. 2017a; Dastidar et al. 2024), along with independent estimates from this work. The right panel shows the histogram of the s1 distribution for SNe II with tPT < 90 days, where those brighter than −18 mag are shown in blue and those fainter than −18 mag in red. |
| In the text | |
|
Fig. 11. Three-dimensional k-means clustering of the SN II sample with plateau durations (tPT) < 90 d, in the parameter space defined by the post-plateau decline rate (s1), the spectral line strength ratio (a/e_30d), and the absolute peak magnitude in V-band (MVmax). Different colours mark the two clusters identified by the algorithm, and the SN names are indicated for reference. |
| In the text | |
|
Fig. A.1. Two-hundred second r-band image of the SN field obtained with the 1 m LCO telescope on 2021 July 30. The location of SN 2021tsz in the low-luminosity host galaxy SDSS J233758.39–002629.6 is marked. The SN is located very close to the galaxy nucleus–0.12″ S and 0.00″ W of the centre. As the host is a low-luminosity dwarf galaxy, the SN outshines it during the early phases, and only the SN is visible in this image. |
| In the text | |
Current usage metrics show cumulative count of Article Views (full-text article views including HTML views, PDF and ePub downloads, according to the available data) and Abstracts Views on Vision4Press platform.
Data correspond to usage on the plateform after 2015. The current usage metrics is available 48-96 hours after online publication and is updated daily on week days.
Initial download of the metrics may take a while.