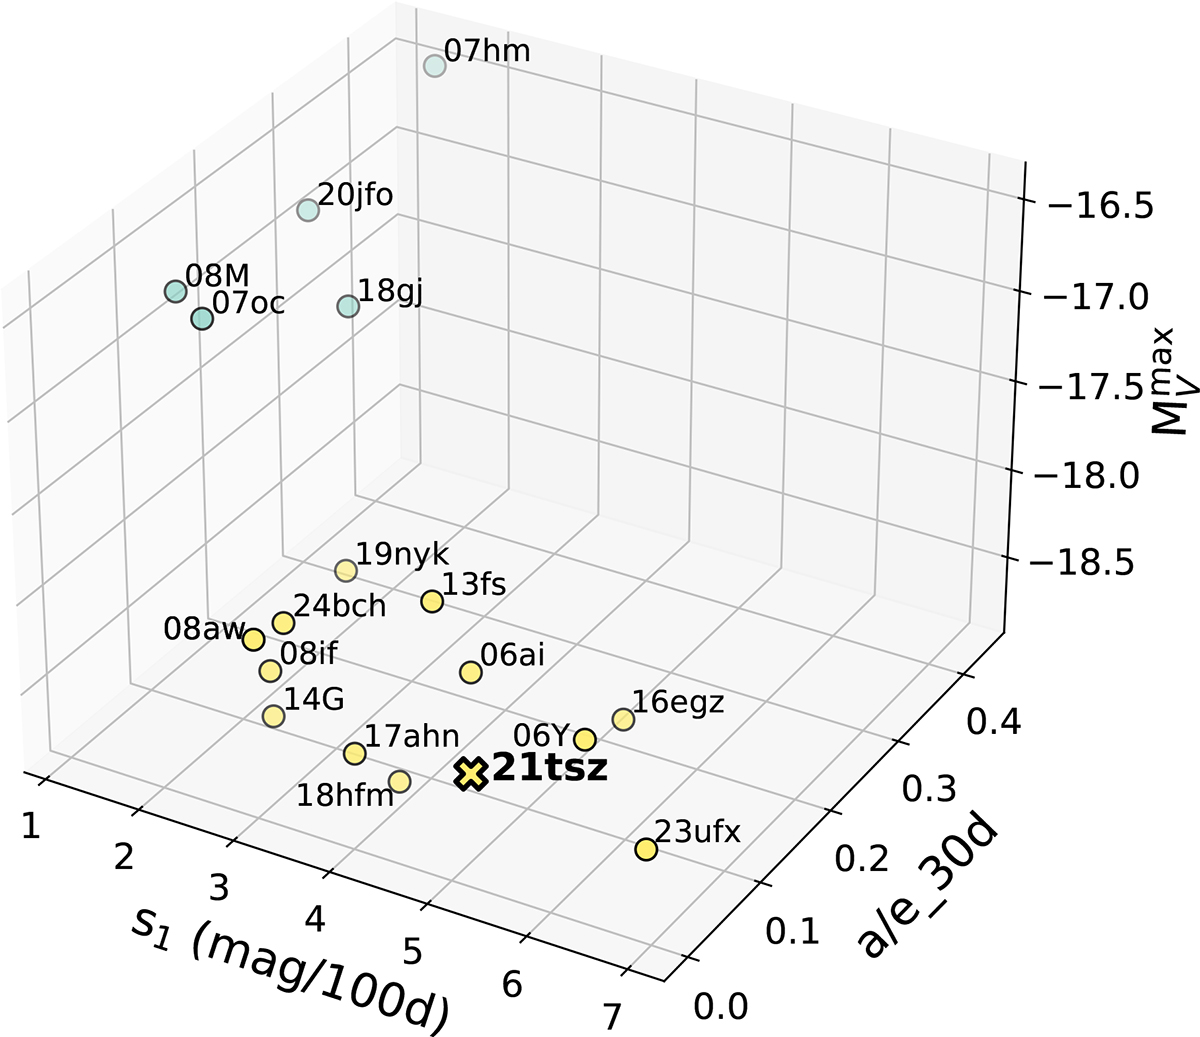
Fig. 11.
Download original image
Three-dimensional k-means clustering of the SN II sample with plateau durations (tPT) < 90 d, in the parameter space defined by the post-plateau decline rate (s1), the spectral line strength ratio (a/e_30d), and the absolute peak magnitude in V-band (MVmax). Different colours mark the two clusters identified by the algorithm, and the SN names are indicated for reference.
Current usage metrics show cumulative count of Article Views (full-text article views including HTML views, PDF and ePub downloads, according to the available data) and Abstracts Views on Vision4Press platform.
Data correspond to usage on the plateform after 2015. The current usage metrics is available 48-96 hours after online publication and is updated daily on week days.
Initial download of the metrics may take a while.