Open Access
Fig. 6.
Download original image
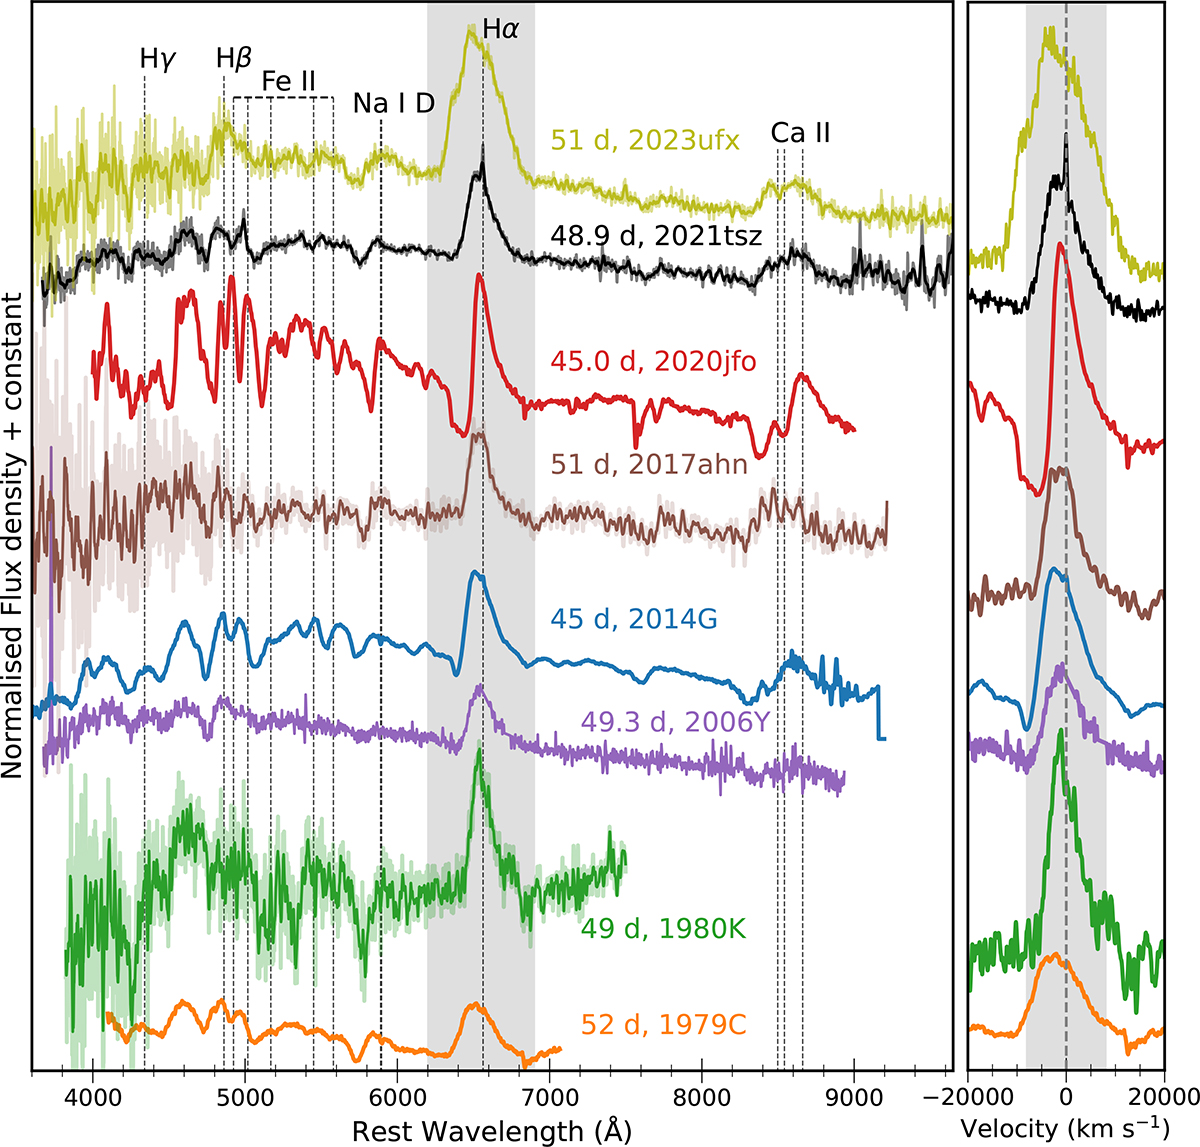
Comparison of 48.9 day spectrum of SN 2021tsz with similar epoch spectra of the comparison sample corrected for both redshift and reddening. On the right, a cut-out of the Hα region is shown in the velocity space, centred at the rest wavelength of Hα.
Current usage metrics show cumulative count of Article Views (full-text article views including HTML views, PDF and ePub downloads, according to the available data) and Abstracts Views on Vision4Press platform.
Data correspond to usage on the plateform after 2015. The current usage metrics is available 48-96 hours after online publication and is updated daily on week days.
Initial download of the metrics may take a while.