Fig. 8.
Download original image
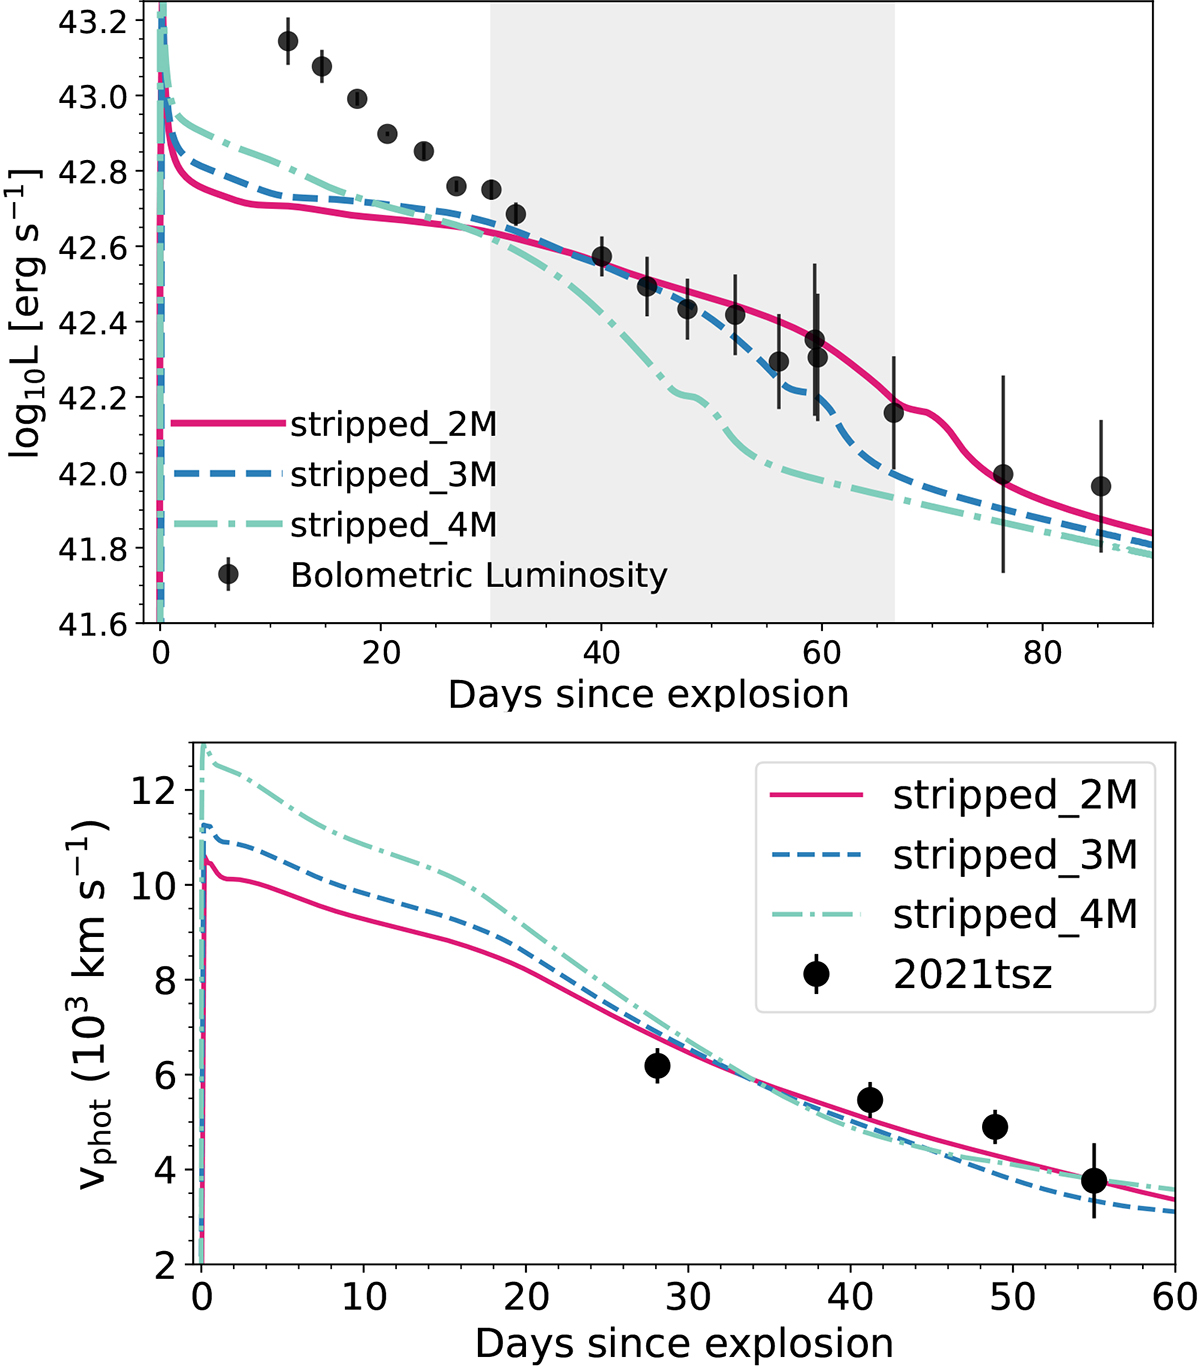
Bolometric light curve models simulated with SNEC without CSM for 2, 3, and 4 M⊙ stripped masses and fixed explosion energy and 56Ni masses of 1.3 × 1051 erg and 0.08 M⊙, respectively, are shown along with the observed light curves in the top panel. The shaded region indicates the time frame used to constrain the extent of mass stripping in the progenitor model. In the bottom panel, the model photospheric velocities are compared to the expansion velocity of SN 2021tsz, derived from the minima of the Fe IIλ5169 absorption line.
Current usage metrics show cumulative count of Article Views (full-text article views including HTML views, PDF and ePub downloads, according to the available data) and Abstracts Views on Vision4Press platform.
Data correspond to usage on the plateform after 2015. The current usage metrics is available 48-96 hours after online publication and is updated daily on week days.
Initial download of the metrics may take a while.