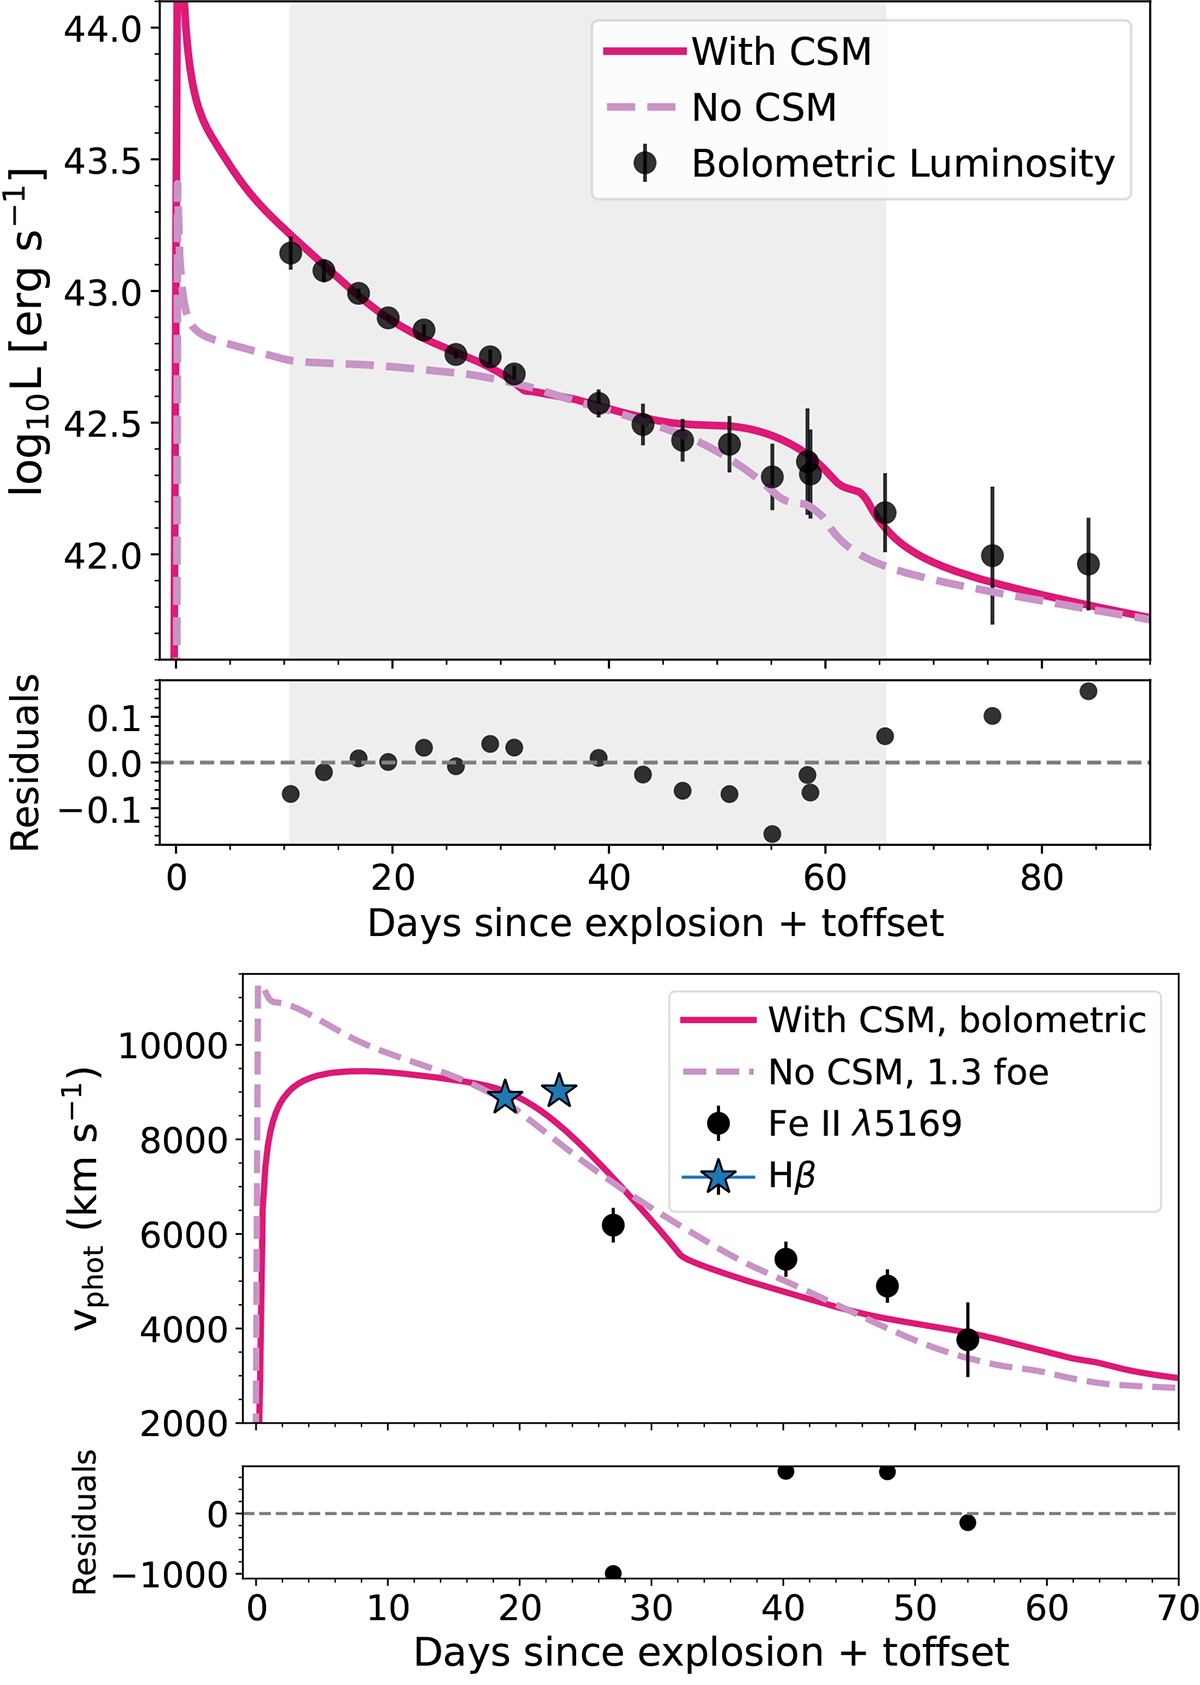
Fig. 9.
Download original image
Comparison of the observed and modelled bolometric light curve and photospheric velocity of SN 2021tsz. Top: Observed bolometric light curve alongside the best-fit SNEC model (solid line), obtained by simultaneously fitting the light curve and photospheric velocity up to 70 days. The dashed line shows the model without CSM. The shaded region indicates the fitting interval. Bottom: Model photospheric velocities plotted against observed values, derived from the minima of the Fe IIλ5169 absorption line. An explosion epoch offset of −0.9 days is applied.
Current usage metrics show cumulative count of Article Views (full-text article views including HTML views, PDF and ePub downloads, according to the available data) and Abstracts Views on Vision4Press platform.
Data correspond to usage on the plateform after 2015. The current usage metrics is available 48-96 hours after online publication and is updated daily on week days.
Initial download of the metrics may take a while.