Fig. 2
Download original image
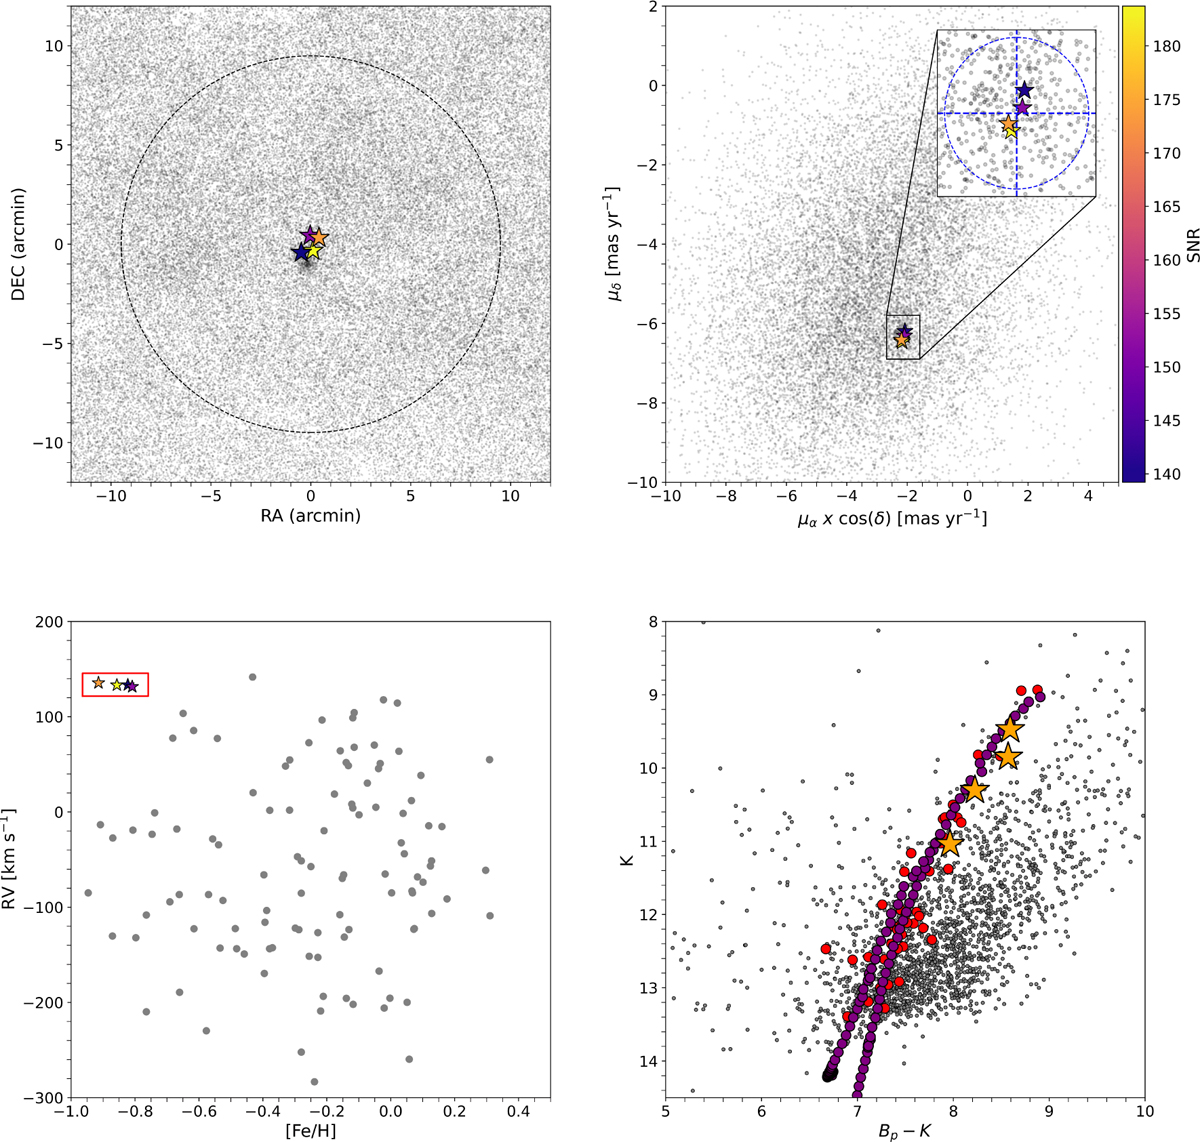
Membership selection of Terzan 2 targets. Top panels (left): spatial position. Star symbols correspond to the selected targets and are color-coded by the S/N of the APOGEE spectra (as is labeled in the color bar in the top right panel; all panels share the same color scale). Other APOGEE targets in the field are gray dots. A circle with the tidal radius 9.49′ (Harris 2010) is overplotted. (right) Proper motion density distribution of stars located within the tidal radius from the cluster center, color- and size-coded as in the top left panel. The inner plot on the top right shows a zoom-in of the cluster in 0.7 × 0.7 mas yr−1 and enclosed in a PM radius of 0.5 mas yr−1 shown in a blue circle. Dashed blue lines are centered on the cluster center PM values (Baumgardt & Vasiliev 2021). Bottom panels (left): radial velocity from ASPCAP vs. metallicity of our members compared to field stars. The [Fe/H] of our targets have been determined with BACCHUS (see Sect. 4), while the [Fe/H] of field stars (gray dots) are taken from the ASPCAP pipeline. The astrometric, photometric, and kinematic parameters used are listed in Table 1. The red box encloses the cluster members within 0.1 dex and 10 km/s from the nominal mean [Fe/H]=−0.84 and RV=10.2 km s−1 of Terzan 2, as determined in this work. (right) CMD corrected by differential reddening and extinction-corrected in the Gaia Bp band and 2MASS K band of our sample and using stars within 9.49′. Our targets all lie along the RGB. The best isochrone fit (purple circles), corresponding to [M/H]= −0.80 is overplotted on Terzan 2 stars (red dots) located within 9.49 arcminutes of the cluster center and has been shifted using E(B−V)=2.081, Aυ=5.16, and Rυ=2.48.
Current usage metrics show cumulative count of Article Views (full-text article views including HTML views, PDF and ePub downloads, according to the available data) and Abstracts Views on Vision4Press platform.
Data correspond to usage on the plateform after 2015. The current usage metrics is available 48-96 hours after online publication and is updated daily on week days.
Initial download of the metrics may take a while.