Fig. 4
Download original image
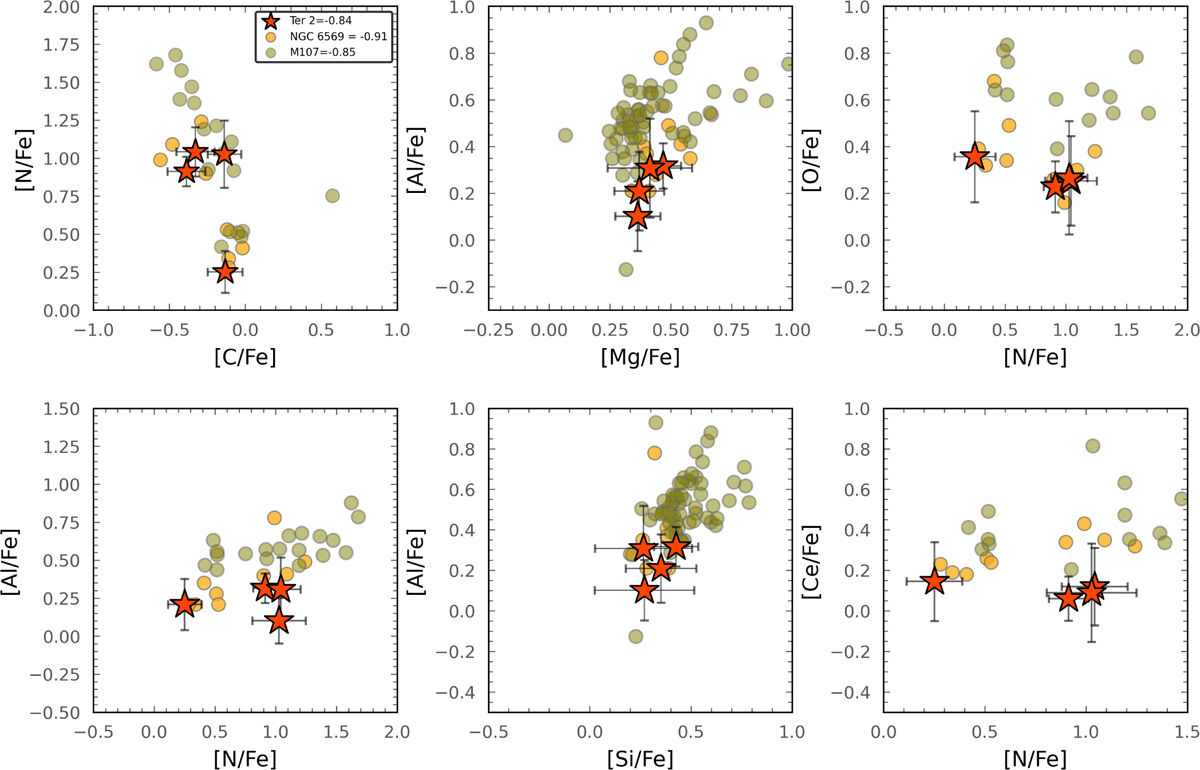
Abundance distributions. From left to right, the top row shows the distributions of [N/Fe]–[C/Fe], [Al/Fe]–[Mg/Fe], and [O/Fe]–[N/Fe]; the bottom row shows [Al/Fe]–[N/Fe], [Al/Fe]–[Si/Fe], and [Ce/Fe]–[N/Fe]. The data correspond to Terzan 2 stars from this work (orange stars), M107 (green circles) from Mészáros et al. (2020), and NGC 6569 (yellow circles) from Barrera et al. (2025). Typical uncertainties for Terzan 2 stars are also indicated.
Current usage metrics show cumulative count of Article Views (full-text article views including HTML views, PDF and ePub downloads, according to the available data) and Abstracts Views on Vision4Press platform.
Data correspond to usage on the plateform after 2015. The current usage metrics is available 48-96 hours after online publication and is updated daily on week days.
Initial download of the metrics may take a while.