Fig. A.1.
Download original image
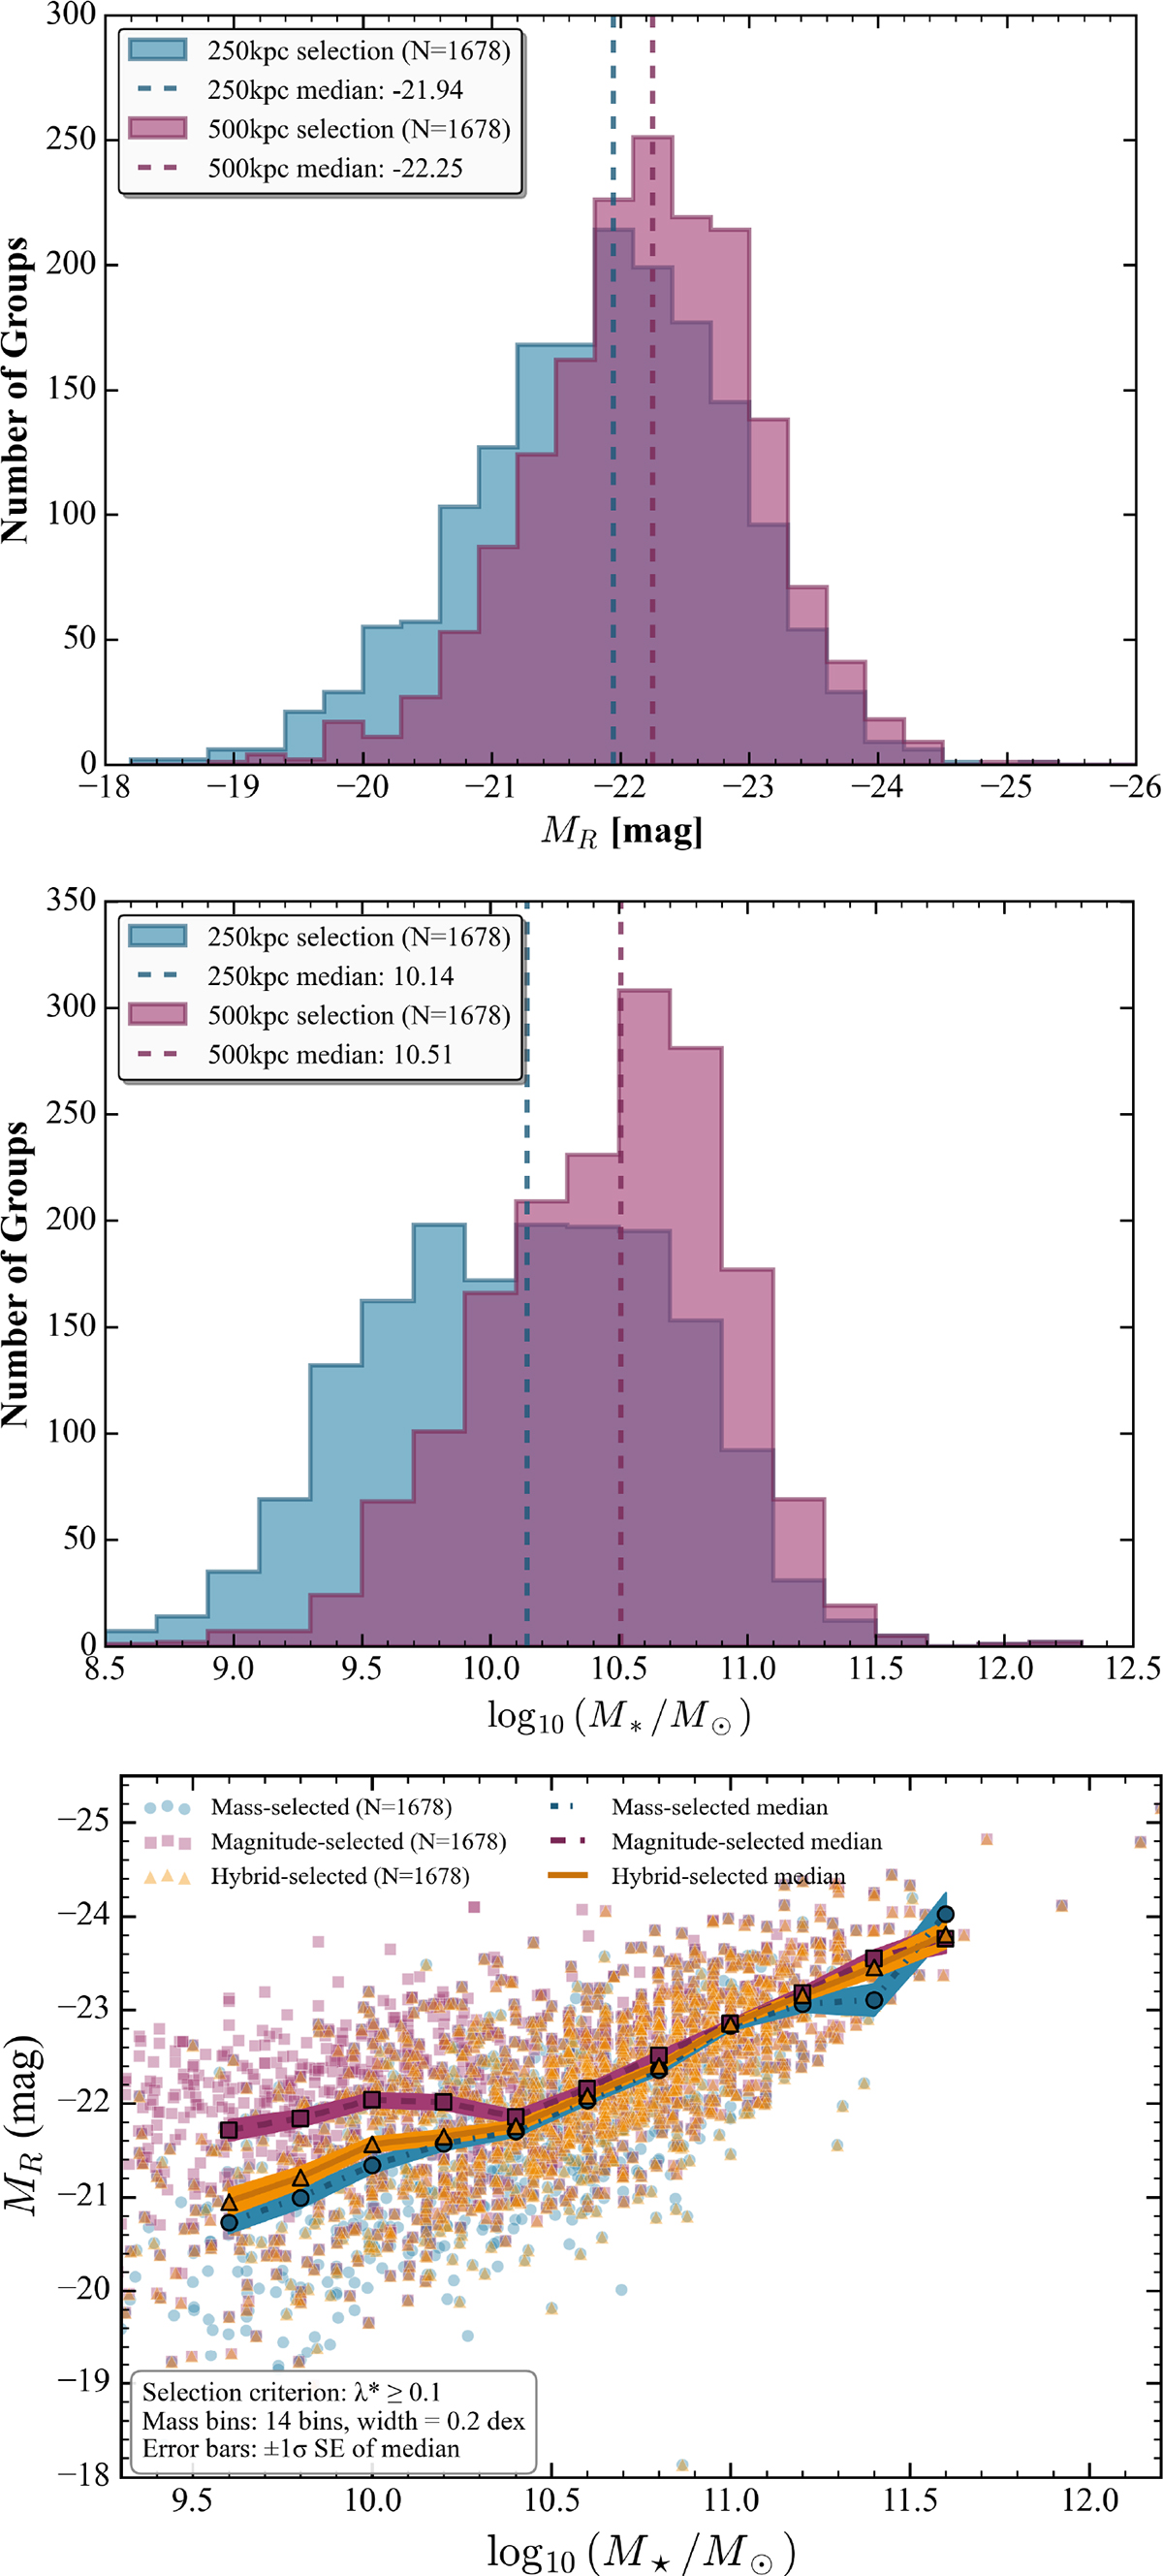
Selection and characterization of BGGs in the COSMOS-Web galaxy group catalog. The top and middle panels show histograms of the number of groups as a function of log stellar mass (log10(M*/M⊙) and absolute magnitude (MR), comparing selections based on two different aperture sizes: 250 kpc (blue) and 500 kpc (magenta). The bottom panel displays a scatter plot of absolute magnitude (MR) versus log stellar mass (log10(M*/M⊙), with points color-coded by selection method: mass-selected (blue circles), magnitude-selected (red squares), and hybrid-selected (green triangles). The solid brown, blue dash-dotted, and magenta dashed lines represent the medians for mass-selected, magnitude-selected, and hybrid-selected methods. The shaded regions around the median lines show the corresponding confidence bands.
Current usage metrics show cumulative count of Article Views (full-text article views including HTML views, PDF and ePub downloads, according to the available data) and Abstracts Views on Vision4Press platform.
Data correspond to usage on the plateform after 2015. The current usage metrics is available 48-96 hours after online publication and is updated daily on week days.
Initial download of the metrics may take a while.