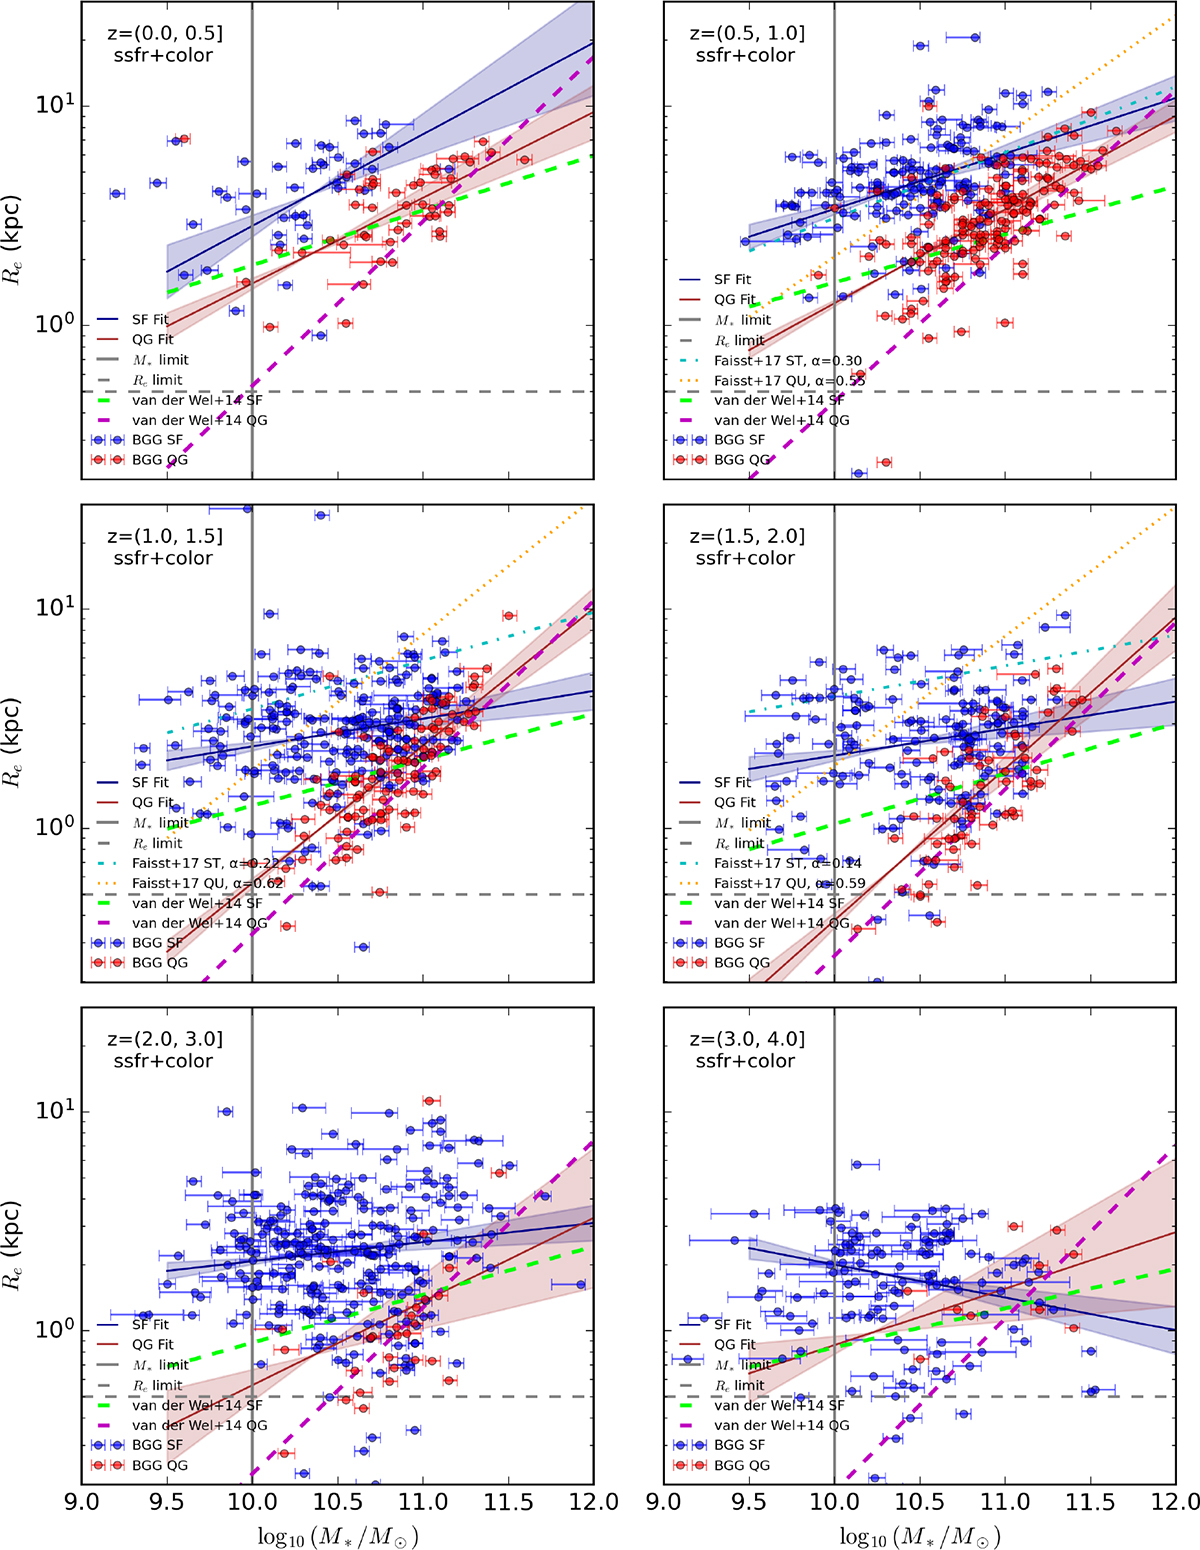
Fig. D.1.
Download original image
Size–mass relation of BGGs classified using the consensus (color+sSFR) method, shown across six redshift bins from z = 0.08 to z = 3.7. Blue circles represent star-forming BGGs, and red hexagons show quiescent BGGs. The dashed and solid lines indicate best-fit power-law relations for SFGs and QGs, respectively, with shaded bands showing 1σ uncertainties. Cyan dashed-dotted and orange dotted lines show comparison relations from Faisst et al. 2017, while dashed lime and dashed magenta lines show van der Wel et al. 2014 results. Gray vertical and horizontal lines represent the stellar mass limit of log10(M*/M⊙) > 10 and size cut of Re > 0.5 kpc, applied when fitting size-mass relation. The BGGs generally follow similar evolutionary trends but are slightly smaller at fixed mass, especially among quiescent centrals, highlighting the impact of group environment on galaxy structure.
Current usage metrics show cumulative count of Article Views (full-text article views including HTML views, PDF and ePub downloads, according to the available data) and Abstracts Views on Vision4Press platform.
Data correspond to usage on the plateform after 2015. The current usage metrics is available 48-96 hours after online publication and is updated daily on week days.
Initial download of the metrics may take a while.