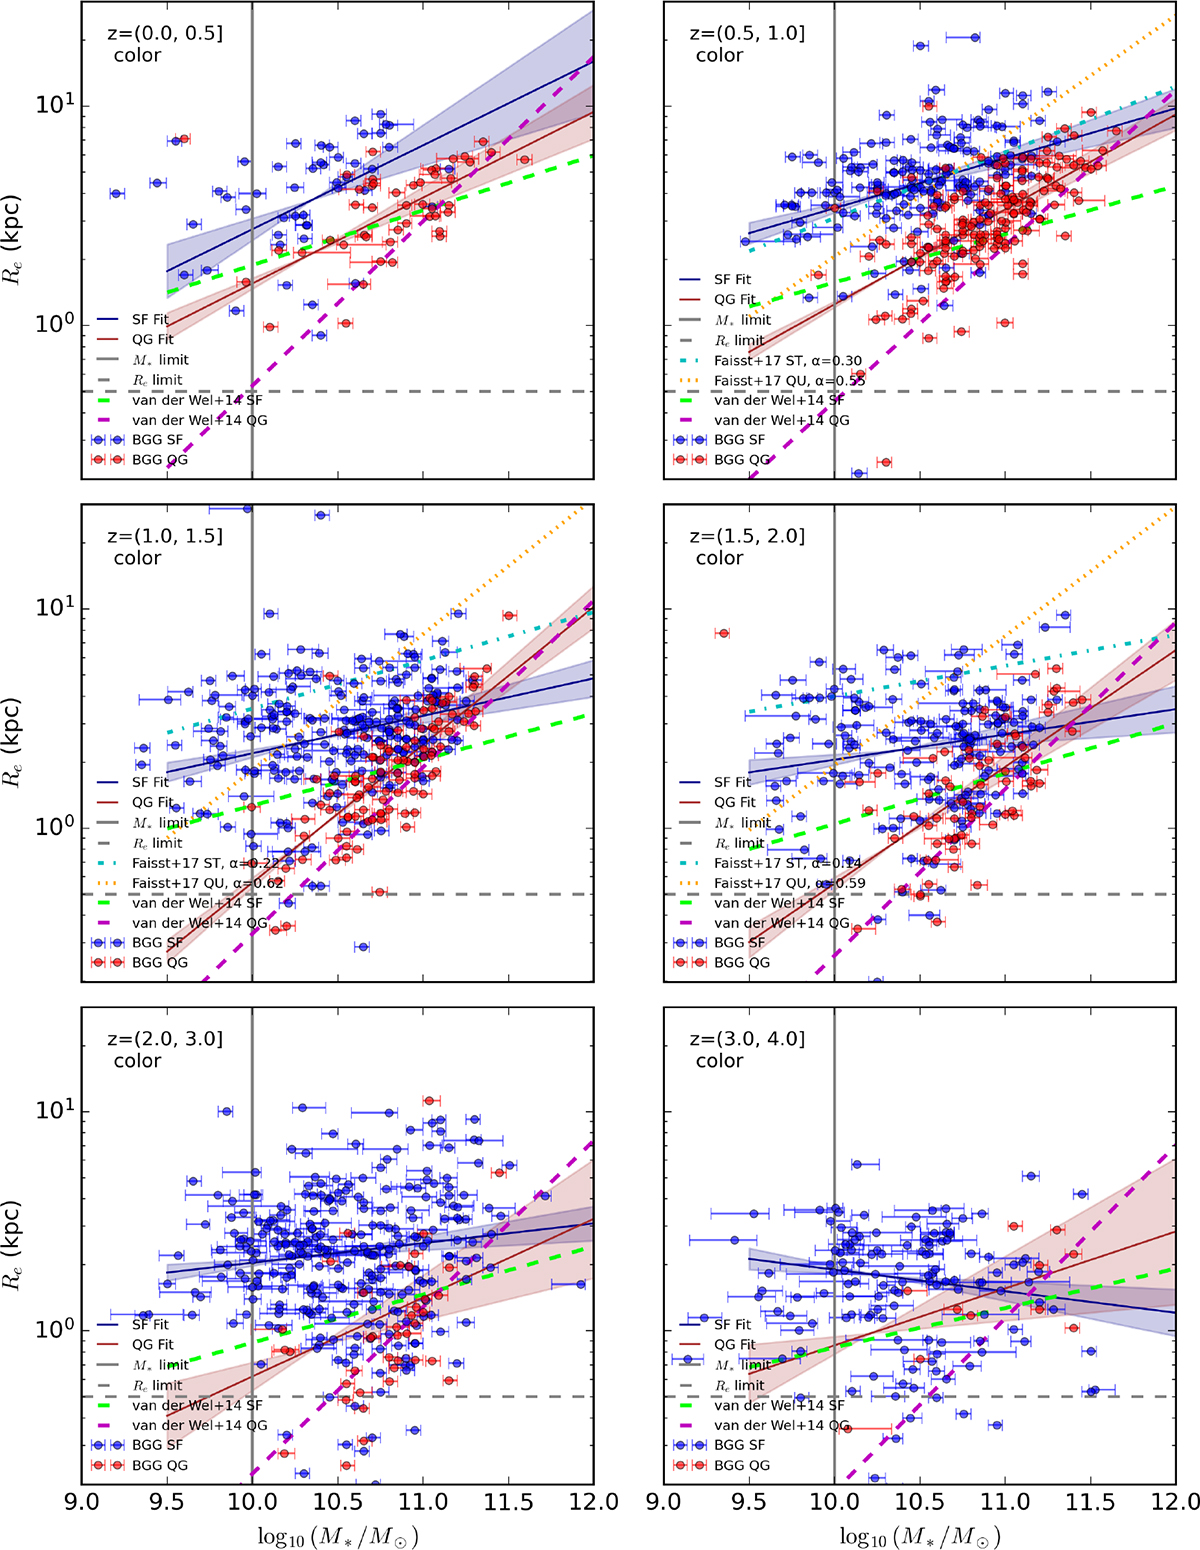
Fig. D.2.
Download original image
Size–mass relation of BGGs using color-only classification. Panels show BGGs across six redshift bins from z = 0 to z = 3.7 (Δz = 0.5). Blue circles represent star-forming BGGs and red circles show quiescent BGGs, as identified using rest-frame NUV–r–J colors. The dashed and solid lines represent best-fit size–mass relations for SFGs and QGs, respectively, with shaded regions indicating 1σ uncertainties. SFGs show generally shallower slopes and larger sizes, while QGs are more compact, especially below z ∼ 2. This classification is sensitive to dust reddening and intermediate colors. Results from Faisst et al. 2017 are shown as cyan dashed-dotted (SFGs) and orange dotted (QGs) lines in matching redshift bins for comparison. While dashed lime and dashed magenta lines show van der Wel et al. 2014 results.
Current usage metrics show cumulative count of Article Views (full-text article views including HTML views, PDF and ePub downloads, according to the available data) and Abstracts Views on Vision4Press platform.
Data correspond to usage on the plateform after 2015. The current usage metrics is available 48-96 hours after online publication and is updated daily on week days.
Initial download of the metrics may take a while.