Fig. E.1.
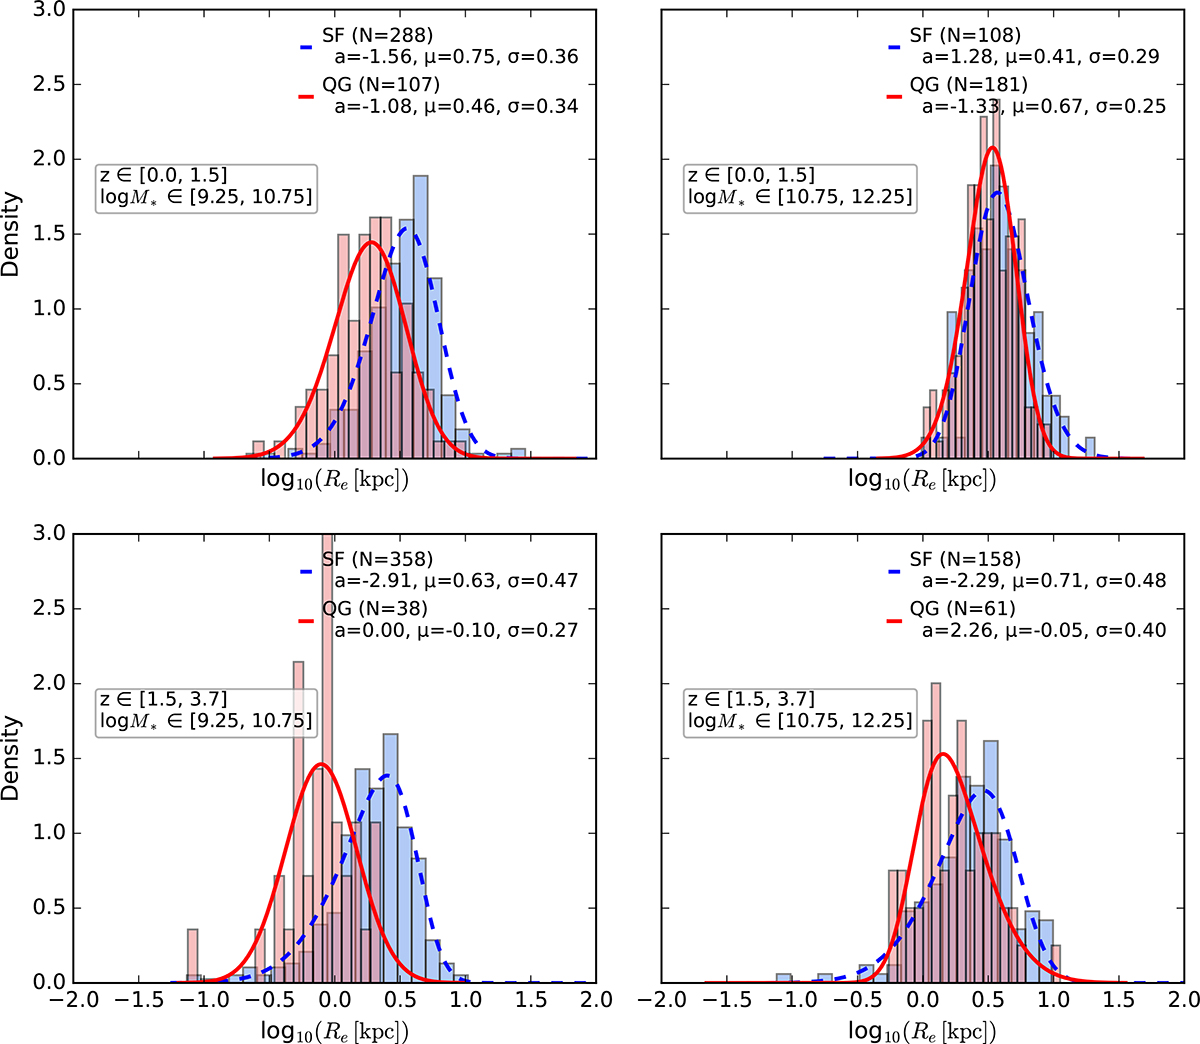
Download original image
Distributions of log10(Re/kpc) for Brightest Group Galaxies (BGGs) in two stellar-mass bins (9.25 ≤ log10(M*/M⊙) < 10.75 and 10.75 ≤ log10(M*/M⊙) < 12.25), split into two redshift intervals (0 < z ≤ 1.5 and 1.5 < z ≤ 3.7). Star-forming galaxies (SFGs) and quiescent galaxies (QGs) are shown as blue and red histograms, respectively, with skew-normal fits overlaid (dashed for SFGs, solid for QGs). Legends list the number of galaxies and best-fit parameters a, μ, and σ.
Current usage metrics show cumulative count of Article Views (full-text article views including HTML views, PDF and ePub downloads, according to the available data) and Abstracts Views on Vision4Press platform.
Data correspond to usage on the plateform after 2015. The current usage metrics is available 48-96 hours after online publication and is updated daily on week days.
Initial download of the metrics may take a while.