Fig. 3.
Download original image
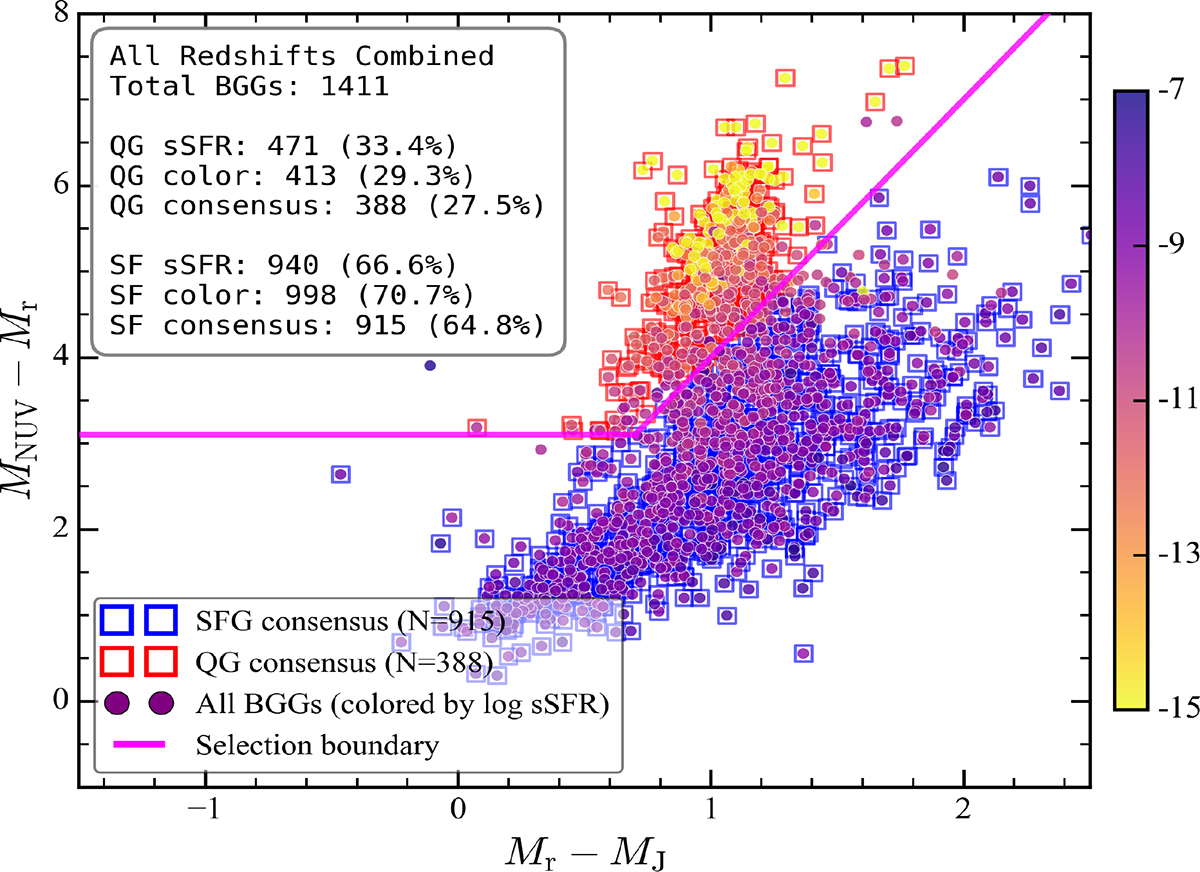
Rest-frame NUV–r versus r–J color–color diagram for all BGGs combined across the full redshift range z = 0 to z = 4. Points are color-coded by their log10(sSFR/yr−1). Magenta lines delineate the quiescent region defined by ![]() and
and ![]() . Open red and blue squares denote BGGs classified as quiescent and star-forming, respectively, under both color and sSFR criteria. Star-forming BGGs dominate at higher redshifts (z ≳ 2), while the fraction of quiescent systems increases at lower redshifts. Full redshift-binned versions of this diagram (in Δz = 0.5 steps) are available in Section 6.
. Open red and blue squares denote BGGs classified as quiescent and star-forming, respectively, under both color and sSFR criteria. Star-forming BGGs dominate at higher redshifts (z ≳ 2), while the fraction of quiescent systems increases at lower redshifts. Full redshift-binned versions of this diagram (in Δz = 0.5 steps) are available in Section 6.
Current usage metrics show cumulative count of Article Views (full-text article views including HTML views, PDF and ePub downloads, according to the available data) and Abstracts Views on Vision4Press platform.
Data correspond to usage on the plateform after 2015. The current usage metrics is available 48-96 hours after online publication and is updated daily on week days.
Initial download of the metrics may take a while.