Open Access
Fig. 1
Download original image
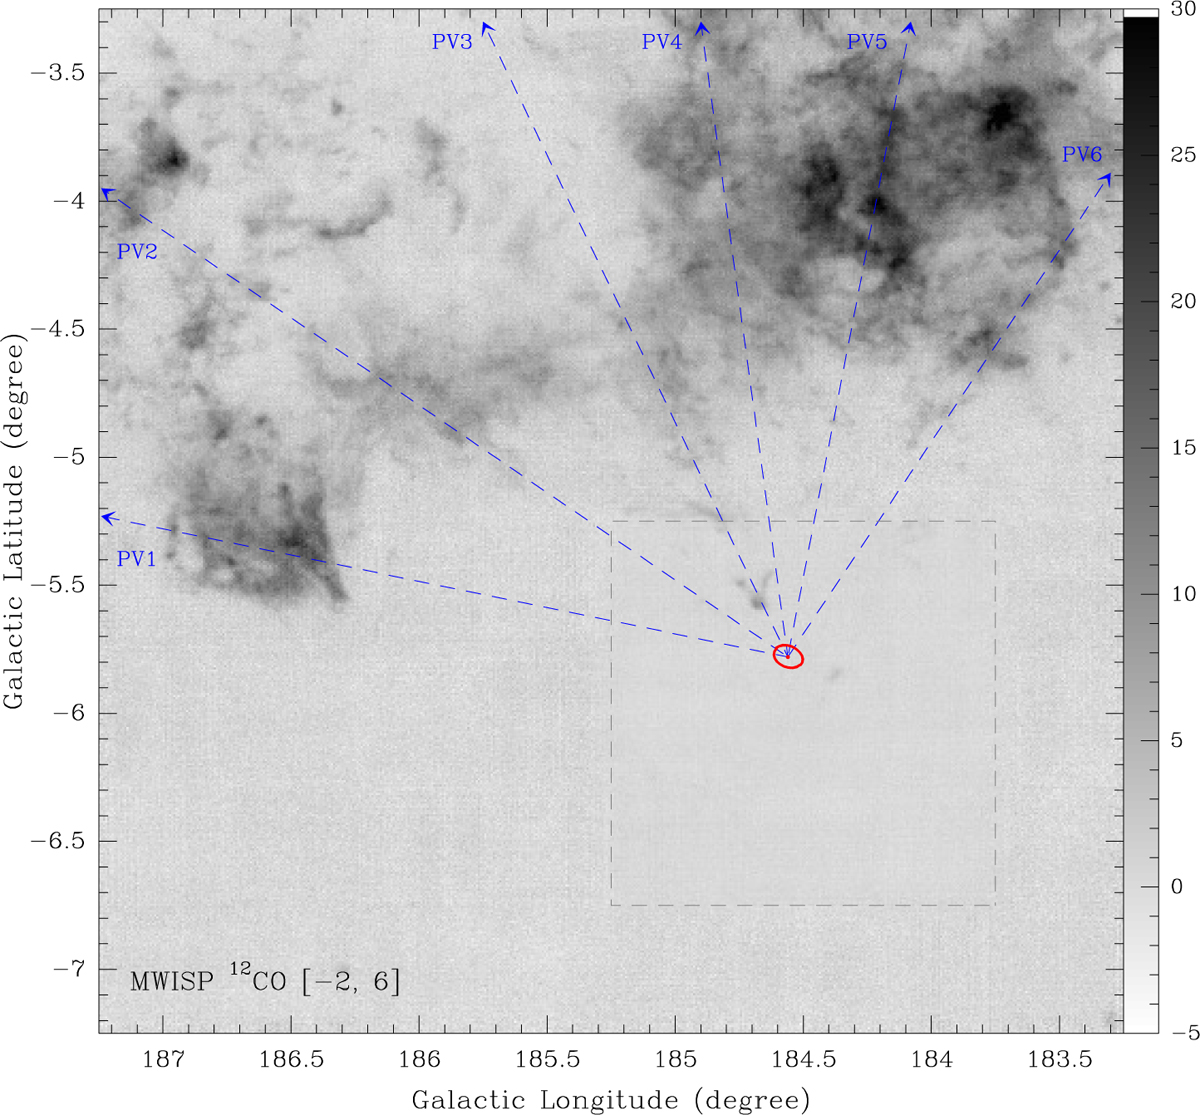
Intensity image of the MWISP 12CO (1–0) emission, integrated in the velocity range −2 to 6 km s−1. The dashed grey square shows the area of deep mapping observations. The red ellipse shows the position and size (7′ × 5′) of the Crab Nebula. The dashed blue arrow lines show the routings of the PV diagrams in Figure 2.
Current usage metrics show cumulative count of Article Views (full-text article views including HTML views, PDF and ePub downloads, according to the available data) and Abstracts Views on Vision4Press platform.
Data correspond to usage on the plateform after 2015. The current usage metrics is available 48-96 hours after online publication and is updated daily on week days.
Initial download of the metrics may take a while.