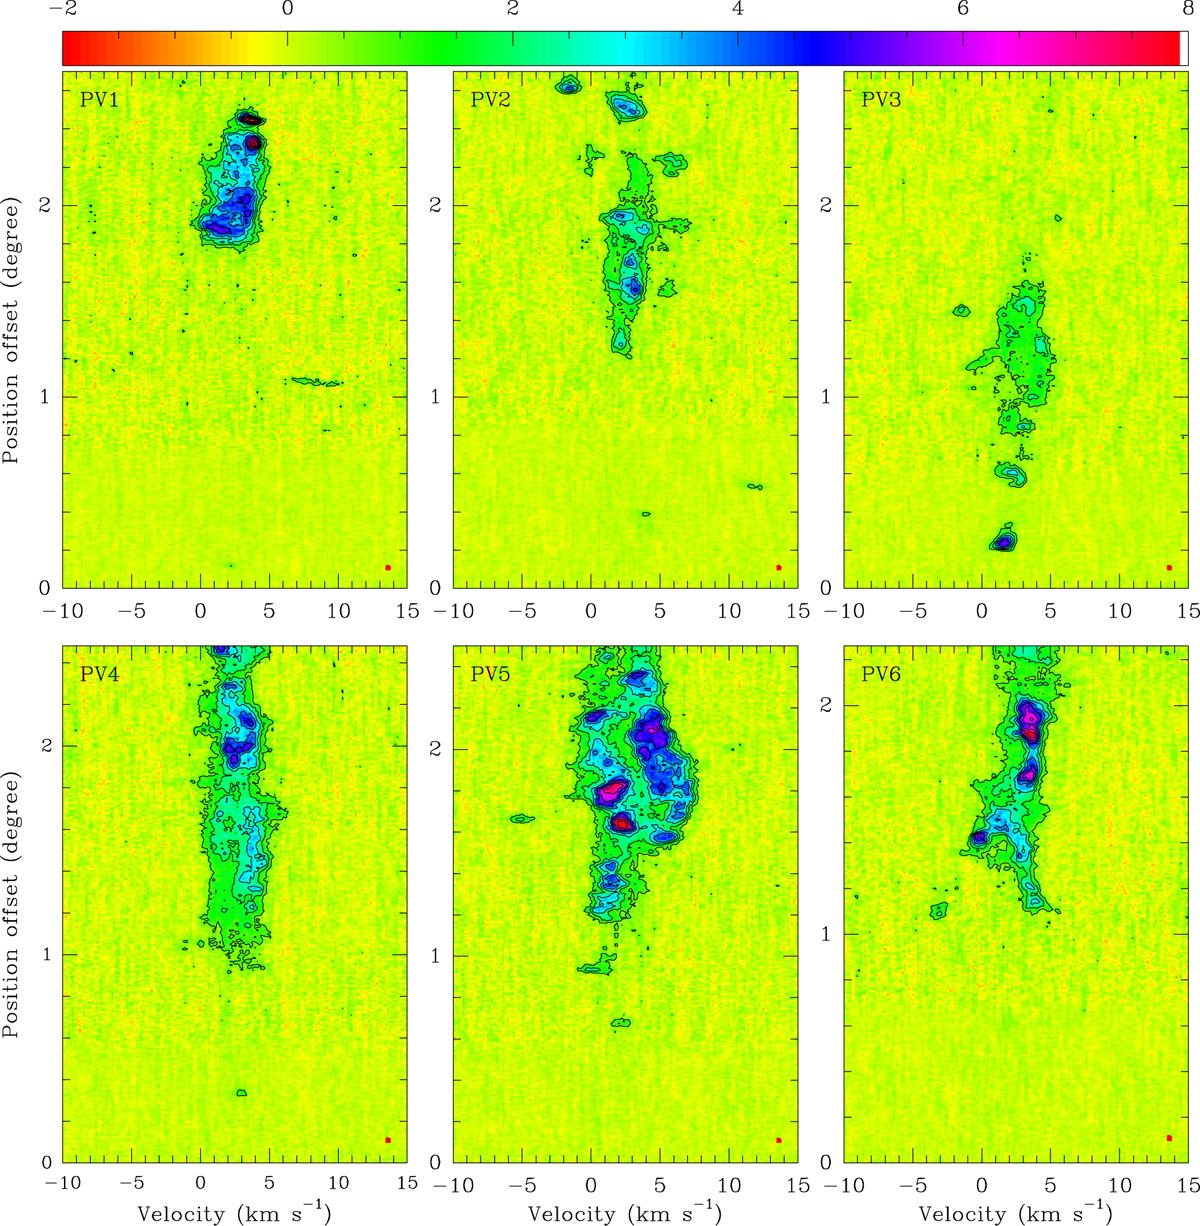
Fig. 2
Download original image
PV diagrams from the Crab across the north molecular cloud (see the routings shown in Figure 1). In each panel, the contours start at 3 σ and then increase in steps of 4 σ, where 1 σ in the large-field 12CO observations is roughly 0.25 K. The red rectangle in the bottom-right corner of each panel shows the angular (52″) and velocity (0.16 km s−1) resolution in the MWISP 12CO observations.
Current usage metrics show cumulative count of Article Views (full-text article views including HTML views, PDF and ePub downloads, according to the available data) and Abstracts Views on Vision4Press platform.
Data correspond to usage on the plateform after 2015. The current usage metrics is available 48-96 hours after online publication and is updated daily on week days.
Initial download of the metrics may take a while.