Fig. 3
Download original image
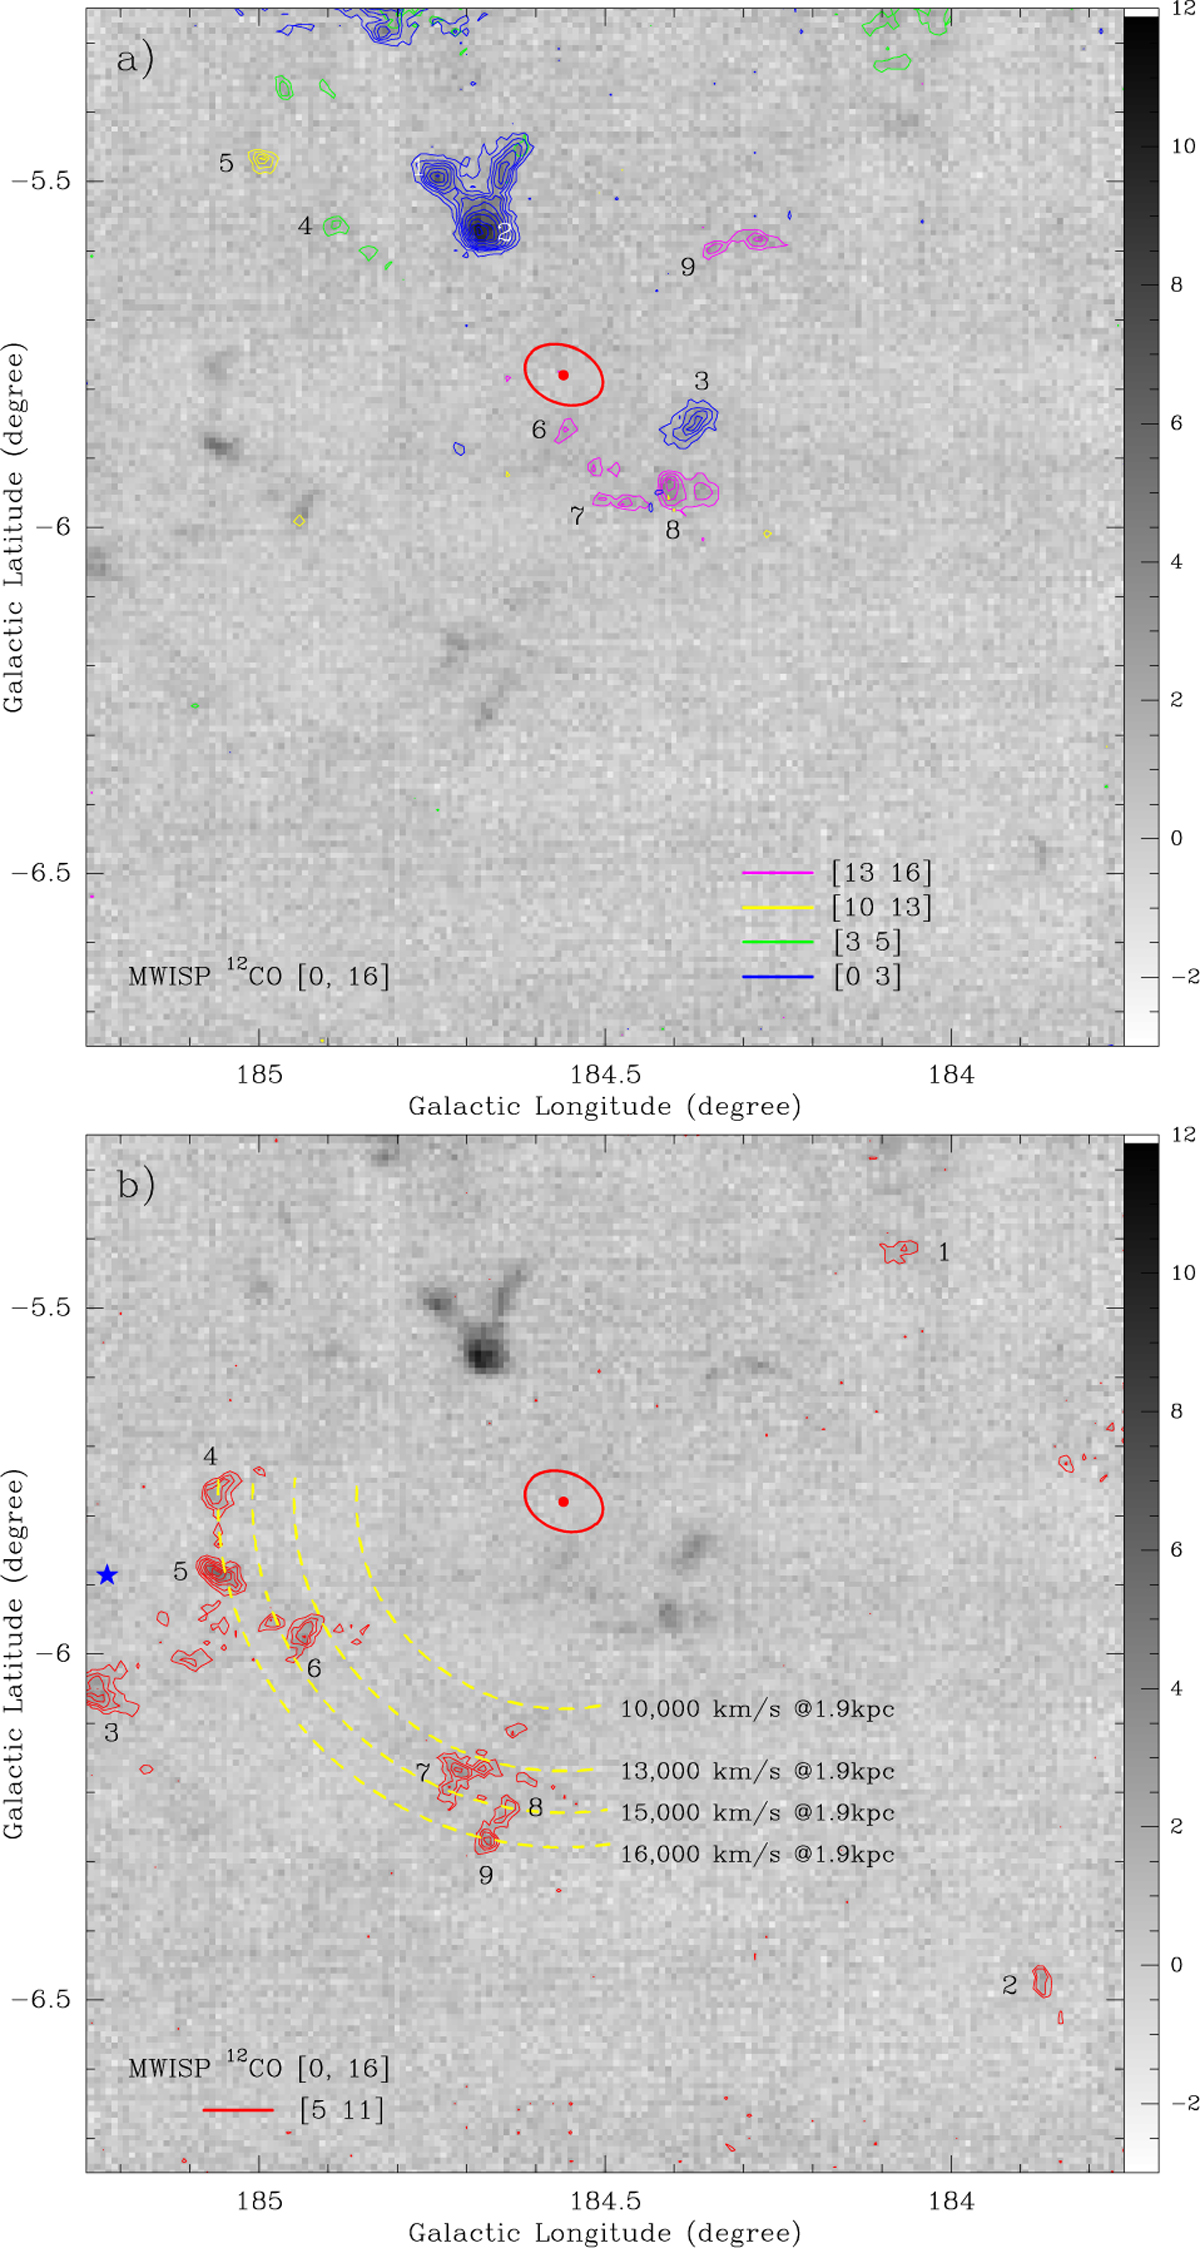
12CO intensity image (grey scale) in the deep observations, integrated within the velocity range [0, 16] km s−1. The red ellipse shows the position and size (7′ × 5′) of the Crab Nebula, while the red dot at the center of the ellipse shows the FWHM beam (52″) in the MWISP 12CO observations at the position of the pulsar (![]() ). (a) CO emission of the clouds integrated within individual velocity ranges, starting from 4 σ, 7 σ, 10 σ, 13 σ, and 17 σ and then increasing in steps of 5σ. 1 σ corresponds to ~0.23 K km s−1 for the [0, 3] km s−1 (blue) and [10, 13] (yellow) and ~0.19 K km s−1 for the [3, 5] (green) and [13, 16] (pink) velocity ranges. The numbers mark the positions of the clouds from which the CO spectra were sampled (see Figure A.4). (b) CO emission of the clouds integrated within the velocity range [5, 11] km s−1, starting from 3σ, 5 σ, and 7 σ and then increasing in steps of 3σ. 1 σ corresponds to ~0.33 K km s−1. The numbers mark the positions of the clouds from which the CO spectra were sampled (see Figure A.4). The blue star marks the position of the O7 star SAO 77293 (also known as HD 36879). Dashed yellow arcs show the putative outer shocks from SN 1054 at different velocities.
). (a) CO emission of the clouds integrated within individual velocity ranges, starting from 4 σ, 7 σ, 10 σ, 13 σ, and 17 σ and then increasing in steps of 5σ. 1 σ corresponds to ~0.23 K km s−1 for the [0, 3] km s−1 (blue) and [10, 13] (yellow) and ~0.19 K km s−1 for the [3, 5] (green) and [13, 16] (pink) velocity ranges. The numbers mark the positions of the clouds from which the CO spectra were sampled (see Figure A.4). (b) CO emission of the clouds integrated within the velocity range [5, 11] km s−1, starting from 3σ, 5 σ, and 7 σ and then increasing in steps of 3σ. 1 σ corresponds to ~0.33 K km s−1. The numbers mark the positions of the clouds from which the CO spectra were sampled (see Figure A.4). The blue star marks the position of the O7 star SAO 77293 (also known as HD 36879). Dashed yellow arcs show the putative outer shocks from SN 1054 at different velocities.
Current usage metrics show cumulative count of Article Views (full-text article views including HTML views, PDF and ePub downloads, according to the available data) and Abstracts Views on Vision4Press platform.
Data correspond to usage on the plateform after 2015. The current usage metrics is available 48-96 hours after online publication and is updated daily on week days.
Initial download of the metrics may take a while.