Fig. 5
Download original image
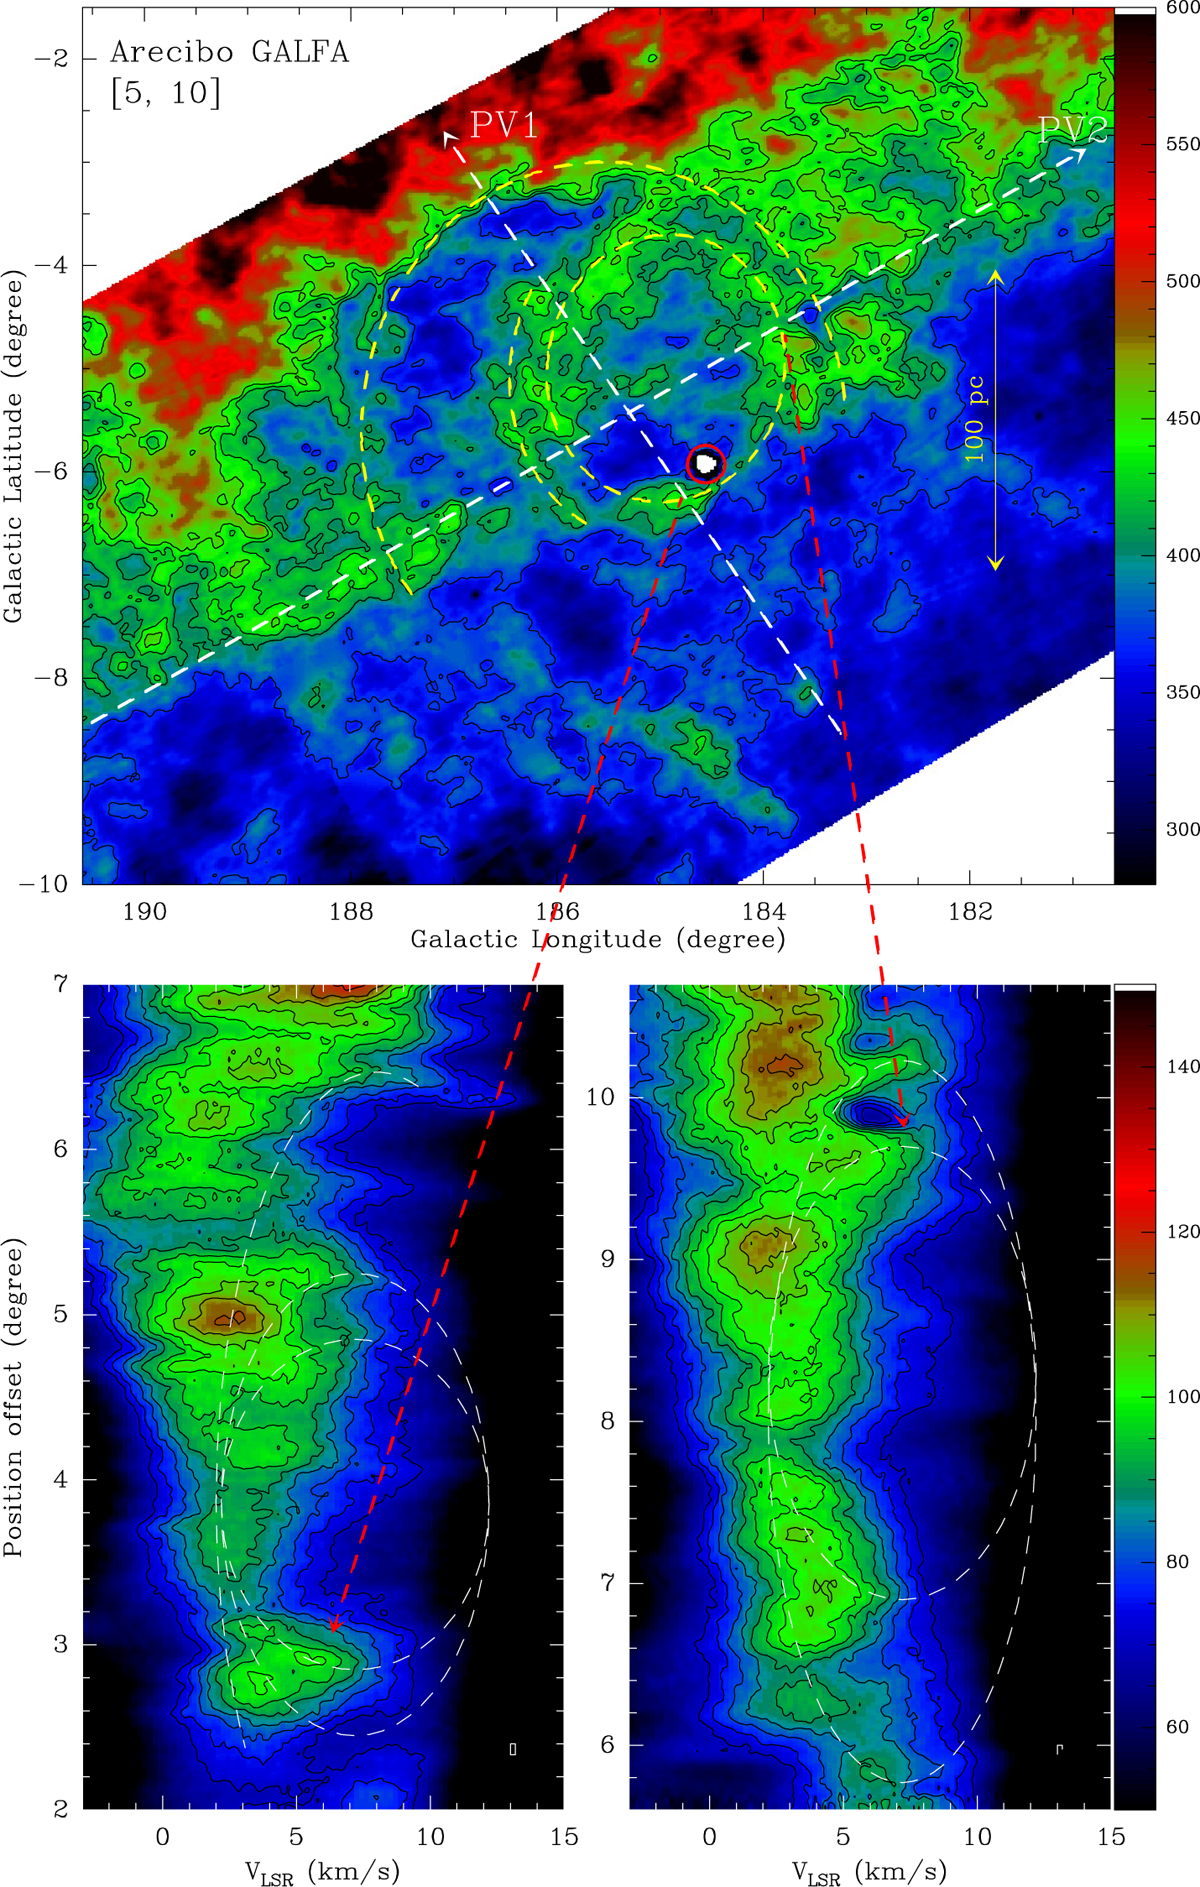
Top: GALFA-HI intensity image, integrated in the velocity range [5, 10] km s−1. The contours correspond to 370, 410, 430, and 450 K km s−1. The red circle shows position of the Crab Nebula. The dashed yellow circles show the bubble and shells distinguished in the HI image, while dashed white arrows show the routings of the PV diagrams shown in the bottom panels. For the two PV diagrams, the contours start from 70 K and then increase in steps of 5 K. The white (partial) ellipses show the fittings towards the cavity-like (spur-like) structures. The white rectangle in the bottom-right corner of the panels shows the angular (4′) and velocity (0.184 km s−1) resolutions in the GALFA-HI survey.
Current usage metrics show cumulative count of Article Views (full-text article views including HTML views, PDF and ePub downloads, according to the available data) and Abstracts Views on Vision4Press platform.
Data correspond to usage on the plateform after 2015. The current usage metrics is available 48-96 hours after online publication and is updated daily on week days.
Initial download of the metrics may take a while.