Fig. 6
Download original image
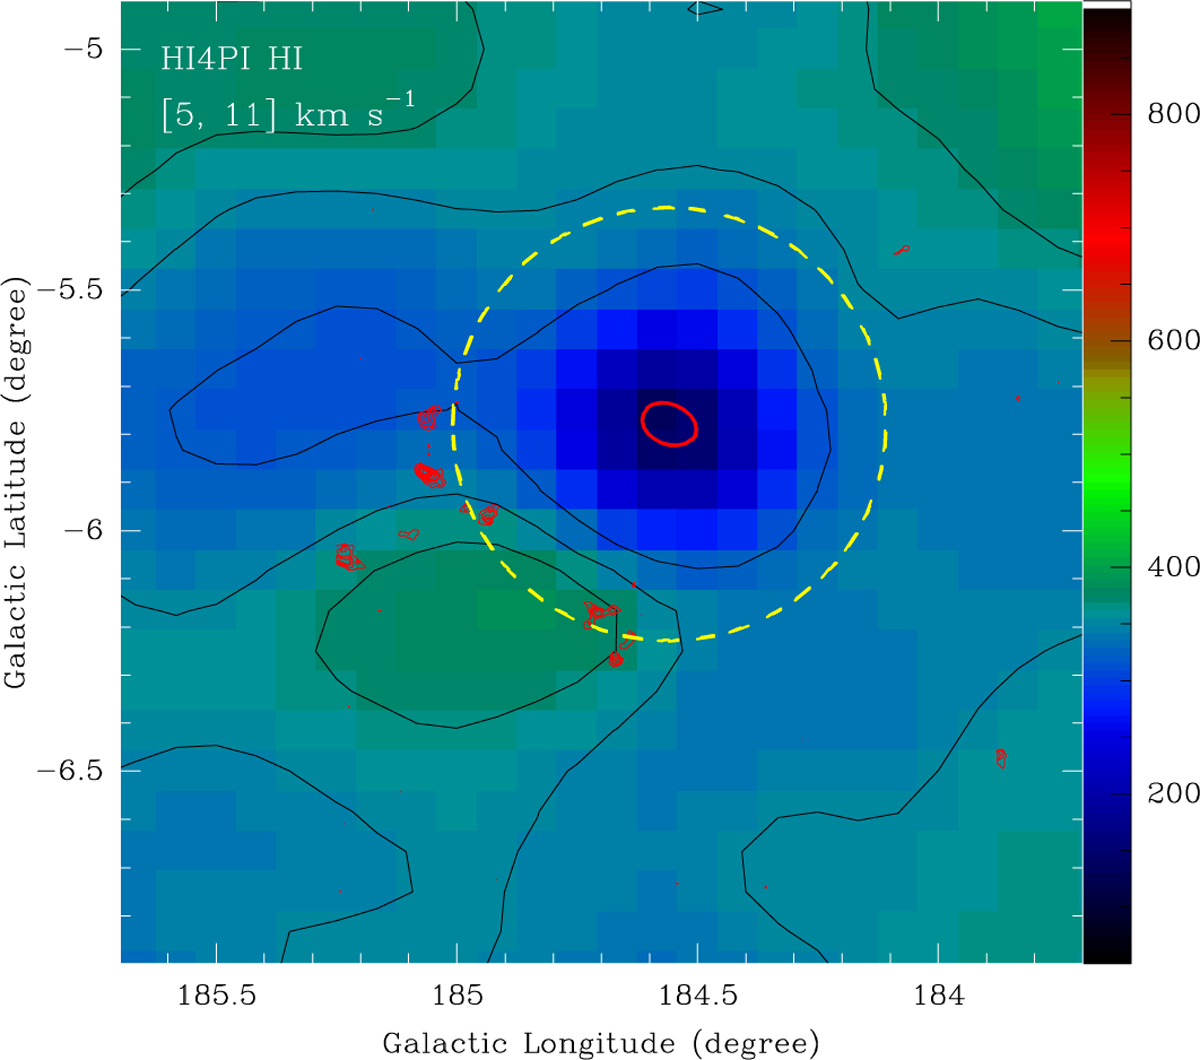
HI4PI HI intensity image, integrated in the velocity range [5, 11] km s−1. The contours start at 320 K km s−1 and then increase in steps of 20 K km s−1. The red contours show the CO emission in the velocity range [5, 11] km s−1 (from Fig 3b), while the dashed yellow circle (radius of ![]() ) shows the putative outer shocks from SN 1054 at a velocity of 15,000 km s−1.
) shows the putative outer shocks from SN 1054 at a velocity of 15,000 km s−1.
Current usage metrics show cumulative count of Article Views (full-text article views including HTML views, PDF and ePub downloads, according to the available data) and Abstracts Views on Vision4Press platform.
Data correspond to usage on the plateform after 2015. The current usage metrics is available 48-96 hours after online publication and is updated daily on week days.
Initial download of the metrics may take a while.