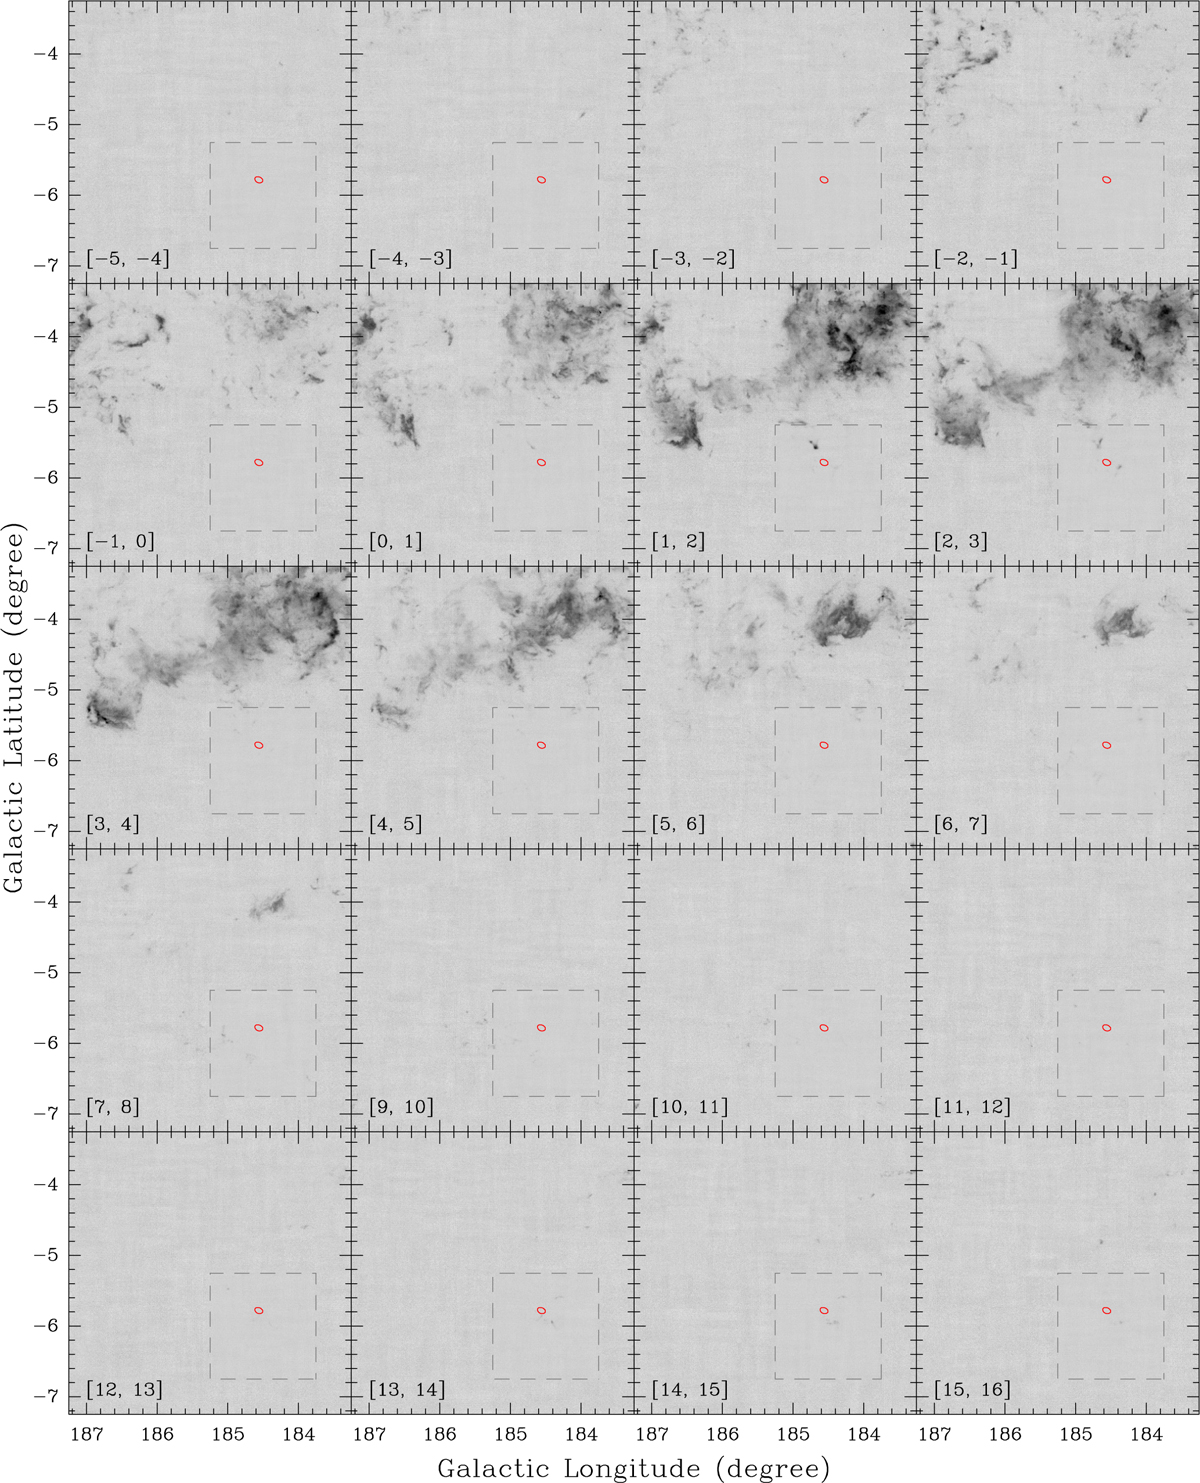
Fig. A.2
Download original image
Velocity-integrated intensity channel maps of the MWISP 12CO (1–0) emission in the large-field observations. The integrated velocity range is written in the bottom-left corner of each panel (in km s−1). The plotting scale for each panel is same (from −2 to 9 K km s−1). In each panel, the dashed grey square shows the area of deep mapping observations, while the red ellipse shows the position and size (7′ × 5′) of the Crab Nebula.
Current usage metrics show cumulative count of Article Views (full-text article views including HTML views, PDF and ePub downloads, according to the available data) and Abstracts Views on Vision4Press platform.
Data correspond to usage on the plateform after 2015. The current usage metrics is available 48-96 hours after online publication and is updated daily on week days.
Initial download of the metrics may take a while.