| Issue |
A&A
Volume 703, November 2025
|
|
|---|---|---|
| Article Number | A125 | |
| Number of page(s) | 12 | |
| Section | Interstellar and circumstellar matter | |
| DOI | https://doi.org/10.1051/0004-6361/202556101 | |
| Published online | 10 November 2025 | |
Spectral survey of the diffuse gas toward BL Lac in the Q band
1
LUX, Observatoire de Paris, PSL Research University, CNRS, Sorbonne Université,
75014
Paris,
France
2
National Radio Astronomy Observatory,
520 Edgemont Road,
Charlottesville,
VA
22903,
USA
3
Observatorio Astronómico Nacional (OAN-IGN),
Calle Alfonso XII, 3,
28014
Madrid,
Spain
4
Observatorio de Yebes (OY-IGN),
Cerro de la Palera s/n,
19141
Yebes, Guadalajara,
Spain
5
Instituto de Física Fundamental, CSIC,
Calle Serrano 123,
28006
Madrid,
Spain
★ Corresponding author: This email address is being protected from spambots. You need JavaScript enabled to view it.
.
Received:
25
June
2025
Accepted:
16
September
2025
Abstract
Context. The chemical composition of diffuse interstellar clouds is not fully established. They host an active chemistry despite their relatively low density and the ubiquitous presence of far-UV radiation.
Aims. To further explore the chemical composition of diffuse clouds, we performed a spectral scan toward the bright radio source BL Lac in the Q band (from 32 to 50 GHz) using the Yebes 40 m telescope.
Methods. Yebes observations were performed interleaving frequency switching and position switching integrations toward BL Lac, using a spectral resolution of 38 kHz. The data were reduced with the CLASS software.
Results. We achieved an unprecedented sensitivity on the continuum of 0.02–0.07%, allowing for the detection of very faint absorption features. We confirm previous detections of HCS+, C3H, C3H+, CH3CN, and HC3N in diffuse clouds and report new detections of CCS, C4H, CH3CHO, H2CCO, HNCO, and H2CS along the line of sight to BL Lac, with abundances relative to H2 from a few 10−11 to a few 10−10. We compiled molecular detections toward diffuse clouds to obtain the chemical inventory of a typical diffuse interstellar cloud.
Conclusions. The chemical inventory of diffuse interstellar clouds includes complex organic species with up to four heavy atoms. These species are efficiently formed in the diffuse interstellar gas and reach abundances similar to those measured in dense photodissociation regions, pointing to similar gas-phase chemical processes.
Key words: line: identification / ISM: clouds / ISM: lines and bands / ISM: molecules / radio lines: ISM / ISM: individual objects: BL Lac
© The Authors 2025
 Open Access article, published by EDP Sciences, under the terms of the Creative Commons Attribution License (https://creativecommons.org/licenses/by/4.0), which permits unrestricted use, distribution, and reproduction in any medium, provided the original work is properly cited.
This article is published in open access under the Subscribe to Open model. This email address is being protected from spambots. You need JavaScript enabled to view it. to support open access publication.
1 Introduction
Diffuse interstellar clouds seen on sight lines at AV ≤ 1 mag had long been thought to be chemically simpler than molecular clouds because they are fully bathed by Far Ultra Violet (FUV) radiation and have moderate densities up to a few hundreds cm−3 (Snow & McCall 2006). In diffuse clouds, dust grains are bare, and no ice mantle can develop, as shown by the threshold for the detection of water ice at AV ~ 3 mag (Boogert et al. 2015). However, this simple view, based on UV and optical spectroscopy, was upset by radio-frequency absorption line spectroscopy toward compact extragalactic continuum sources. In addition to the diatomic species OH, CH, CH+, CO, and CN detectable at UV and optical wavelengths, c-C3H2 (Cox et al. 1988), NH3, and H2CO Nash (1990), HCO+, HNC, HCN, and C2H (Lucas & Liszt 1994, 1996, 2000) were found along sight lines with Aυ = 1 mag far from the Galactic plane. Additional surveys have shown that SO, CS, and CF+, and the polyatomic species HOC+, c-C3H, 1-C3H, 1-C3H2, C3H+, and CH3CN (Liszt et al. 2014, 2018; Gerin et al. 2019) are detectable with abundances relative to H2 ranging from 10−10 to 10−8, reaching levels that are surprisingly close to those of the TMC-1 dark cloud, as cataloged for instance by Gratier et al. (2016). The QUIJOTE1 spectral survey of the TMC-1 dark cloud allowed for a comparison of the relative abundances of cumulene species, such as 1-C3H2, 1-C4H2, and 1-C5H2 (Cabezas et al. 2021), and showed that the first members of the series reach abundances of a few 10−10 with respect to H2. It is interesting to note that some ions are more abundant in the diffuse gas than in TMC-1, especially the important precursor of the carbon chains, C3H+, which is about one order of magnitude more abundant in the diffuse gas than in TMC-1 (Cernicharo et al. 2022). In addition, the HIFI instrument on board the Herschel space mission and the GREAT instrument carried on the SOFIA airplane led to the detection of neutral and ionized hydrides in diffuse interstellar clouds, including the surprising detection of reactive ions such as OH+ and ArH+ (for a review see Gerin et al. 2016).
Numerical simulations of the formation of molecular clouds from atomic gas show that the physical structure of diffuse clouds is related to the transient multiphase structure of the interstellar medium as a whole, with regions of partially-molecular cool gas (the cold neutral medium or CNM) embedded in the warm neutral medium (WNM) (e.g., Valdivia et al. 2017; Godard et al. 2023). These simulations reproduce the statistics of the H2 column densities observed in UV absorption against background massive stars but do not succeed with the current chemical networks in reproducing the observed abundances of molecular species such as HCO+, c-C3H2, and CH3CN (Liszt et al. 2018). The case of HCO+, which is the immediate ancestor of CO (Visser et al. 2009), is particularly important: this ion is widespread and easily detected in absorption toward background quasars (Lucas & Liszt 1996; Liszt & Gerin 2023). These failures show that the models are not yet fully adequate. However, it has been difficult to identify the missing physical and chemical processes because systematic inventories of the composition of template diffuse clouds are not available in the same way as those established for dark clouds or hot cores. The lack of a more complete inventory prohibits searching for relationships between molecules and establishing families of species that could be used for identifying the dominant physical and chemical processes.
The availability of a sensitive broadband 32–50 GHz receiver at the Yebes 40 m telescope offers the opportunity to detect different classes of species than those accessible at millimeter frequencies. The success of the QUIJOTE survey performed with this system in detecting new species, in particular polyatomic molecules, in TMC-1 and other dark clouds (e.g., Cernicharo et al. 2021b, a; Agúndez et al. 2023) shows that many species can reach abundances relative to H2 higher than 10−10. Given the low densities of diffuse clouds, the lowest-energy rotational levels are the most populated, which implies that the most favorable frequency domain shifts toward frequencies below 50 GHz for species with three or more heavy atoms. In this paper, we present the outcome of a deep absorption survey toward the BL Lac (also known as B2200+420) radio source in the Q band. Section 2 presents the observations and data reduction process; Sect. 3 presents the detected spectral features, the derived column densities, and the relative abundances. The new detections are put in the context of molecular abundances in diffuse clouds in Sect. 4, and Sect. 5 presents the final conclusions.
Observation parameters.
2 Observations and data reduction
The sight line toward BL Lac is known to exhibit intervening absorption by foreground diffuse clouds, with a reddening of E(B-V) = 0.32 mag corresponding to one magnitude of visual extinction, a total hydrogen column density of about N(H) = N(HI) + 2N(H2) = 2.7 × 1021 cm−2, and a relatively high fraction of hydrogen in molecular form  of 0.66 (Liszt & Pety 2012). At a Galactic latitude of −10.4°, the absorbing gas is located within 1 kpc (Green et al. 2019; Lallement et al. 2022), with a likely distance of ~500 pc. HI absorption is detected across the velocity range between −10 and 10 km s−1, while molecular absorption is more localized between −3 and 1 km s−1 in the blue wing of the HI absorption. CO emission and absorption lines are quite strong along this sight line, in agreement with the high fraction of gas in molecular form.
We used the Yebes 40 m telescope to perform an absorption survey toward the BL Lac radio source in April, May, and June 2024 under the project code 24A023 as summarized in Table 1. The observations were performed in frequency switching (FSW) mode, using a frequency throw of 10.52 MHz. In addition, every ~1.25 hours, we checked the pointing and performed position switching (PSW) observations with a reference position located at equatorial coordinates (J2000) Right Ascension (RA)= 22h02m36s and Declination (Dec) = +42°15′30″, a molecular line emission-free position nearby the target source (see Liszt 2020), to measure the continuum flux and follow the variations of the telescope efficiency with the ambient temperature and telescope elevation.
The telescope pointing was checked using BL Lac and the nearby HII region DR21 as pointing sources. BL Lac was flaring during the time of these observations with a peak temperature of ~4 K corresponding to ~14 Jy at 32 GHz, which allowed us to check the pointing accuracy on the source itself with high confidence. To avoid spurious signals and sideband ambiguities in the detected line frequencies and better cover the spectral range, we used two frequency tunings, with a separation of 900 MHz in the local oscillator frequencies. The Q-band receiver allowed us to measure the spectral range from 32 to 50 GHz with a spectral resolution of 38 kHz (equivalent to 0.356 km s−1 at 32 GHz), observing the H and V polarizations simultaneously. The backend is composed of a series of eight Fast Fourier Transform spectrometer (FFT) elements per polarization, for a total of sixteen spectral windows. The system and telescope performances have been described in Tercero et al. (2021). The data were reduced with the CLASS software, which is part of the GILDAS package2. For each day of observations, we analyzed the data as follows. For each frequency tuning and each of the 16 spectral windows, the spikes leading to spurious signals were flagged and the spectra interpolated in the small frequency intervals of these spikes. The PSW data and FSW data were separately averaged to obtain a PSW and a FSW spectrum for each spectral window. The FSW data were folded at this step. We removed a continuum offset (flat baseline) and a sine wave function associated with a known baseline ripple in this observing mode. To produce continuum-divided spectra, we first smoothed the PSW spectra in each spectral window to a coarse spectral resolution of 380 MHz to obtain a noise-free continuum spectrum. We then added the continuum to the FSW spectra and co-added the full spectral resolution FSW and PSW spectra to obtain the source spectrum. We divided this spectrum by the noise-free, smoothed PSW continuum spectrum to obtain the absorption spectrum normalized to the continuum. We performed these operations each day and for each polarization because the continuum flux of BL Lac is variable and presents significant polarization. Information on the BL Lac continuum flux during the observations is provided in Appendix A.
In the final step, we averaged the data gathered from the different days and from the two polarizations, and combined the two frequency tunings to obtain the final continuum-divided spectrum that was used for line detection. The resulting noise level on the normalized spectrum is 3 × 10⁻⁴ with the lowest values below 40 GHz where the sky transmission is the best and increases to 1 × 10⁻³ near the CS(1−0) line at 49 GHz.
Given the high brightness of BL Lac in the Q band at the Yebes Observatory, with typical zenith opacities during our observations ranging from ~0.05 at 32 GHz to ~0.3 at 49 GHz, this procedure provides accurate relative continuum measurements. The good agreement of the column densities derived in this work (see Sect. 3) for species detected at millimeter frequencies with PdBI or NOEMA such as CS and c-C3H2 (Lucas & Liszt 2000, 2002), as well as the agreement of integrated opacities for the spectral lines previously observed with the Very Large Array (VLA) (Liszt et al. 2018) shows that this procedure provides reliable continuum normalized spectra. Table 1 presents a summary of the observations discussed in this paper.
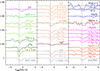 |
Fig. 1 Absorption lines detected toward BL Lac in the Q band. All spectra are normalized by the continuum and shifted vertically for clarity. The fainter lines are scaled as indicated. For comparison, we also show the absorption lines of HCO+ (J = 1 − 0) (Lucas & Liszt 1996), HCN (J = 1 − 0) (Liszt & Lucas 2001), and c-C3H2 ( |

3 Results
3.1 Line identification
The data were inspected for spectral features using the CDMS (Müller et al. 2005; Endres et al. 2016), JPL (Pickett et al. 1998), and MADEX (Cernicharo 2012) line catalogs as references for the molecular line frequencies. Figure 1 shows the detected absorption lines together with earlier detections of HCO+ (J=1−0) (Lucas & Liszt 1996), HCN (J=1−0) (Liszt & Lucas 2001), and c-C3H2 (11,0 − 10,1) (Liszt et al. 2012) for comparison. Table B.1 reports the information on the detected lines in the Q band. As two velocity components are identified along this sight line in some species, the peak opacities and integrated line opacities were determined by fitting either one or two Gaussian profiles to the detected signals, according to the achieved velocity resolution. We checked the quality of the fit by comparing the fitted values with the integrated opacity computed in the velocity range where HCO+ absorption is detected from −3 to 0 km s−1.
The sensitive Q-band survey allows the detection of new spectral lines of already known species such as CS and its iso-topologs C34S and 13CS, SiO, the carbon chains and cycles with three and four carbon atoms C3H, C3H+, C4H, c-C3H2, and 1-C3H2. These new data confirm the previous detection of CH3CN toward BL Lac but with an improved signal-to-noise ratio and add a new detection of HC3N previously found toward the higher extinction sight line of 3C111 (Liszt et al. 2018). The surprise comes from the detection of two organic species thought to be associated with star-forming cores. We find three lines from ketene (H2CCO) corresponding to its ortho and para spin symmetry states, and six lines from acetaldehyde (CH3CHO) associated with its A and E states. A tentative feature can be assigned to a low-energy transition of HNCO and another one to the ground state transition of H2CS. Two transitions of the carbon and sulfur chain CCS, known to be abundant in TMC-1, are detected. The new observations also show absorption from HCS+, which has only previously been detected toward 3C111.
We searched for features from related species, which have transitions in the covered spectral range, CCO, CCN, CH3CCH, C3N, C4H−, and C6H, but find no convincing signal down to the noise level. The achieved noise levels are reported in Table B.2. We also provide upper limits on the relative abundance for these species assuming an excitation temperature of 5 K as a conservative value for the moderate densities encountered along the sight line to BL Lac.
The line profiles are consistent with the known centroid velocity of previously detected absorption lines toward BL Lac near VLSR = −1 km s−1, but different species show different line profiles. Two velocity components are clearly present in the CS and c-C3H2 data, at VLSR = −1.5 and −0.6 km s−1, with the stronger absorption at the more negative velocity, −1.5 km s−1. The profiles of the HCS+ and C3 H+ molecular ions show stronger absorption in the −0.6 km s−1 velocity component, leading to slightly redshifted profiles compared to those of CS. Because of the slightly coarser velocity resolution, the profiles of the lines with frequencies lower than about 35 GHz show only one velocity component. The mean full width at half maximum (FWHM) when fitting a single Gaussian component is 1.3 km s−1. SiO is a clear outlier with a slightly broader profile than the mean, FWHM=1.4 km s−1, and a different centroid velocity, VLSR = −0.2 km s−1, as compared to the centroid velocity for other species between −1.5 and −0.6 km s−1. This behavior is consistent with the SiO formation pathway involving low-velocity shocks (Rybarczyk et al. 2023).
Such differences in the line profiles were also seen toward other sight lines and indicate the presence of density and velocity gradients along the line of sight (e.g., Gerin et al. 2024, for the sight line to NRAO150 (B0355+508)). The abundance variations are related to the different chemical pathways responsible for the formation and destruction of the different species. Species such as CS have an enhanced abundance in the regions with the highest density along the line of sight, which have a smaller velocity dispersion compared to the total velocity dispersion of the molecular gas traced by CCH or HCO+ (Liszt & Gerin 2025). Carbon chains and cycles seem to occupy the full volume and exhibit a velocity dispersion similar to that of HCO+ or CCH. Some molecular ions are more abundant in the lower density regions where the electron fraction is the highest, especially those reacting with H2 such as OH+ and CH+ (Gerin et al. 2016). The observed profile of C3H+, an ion reacting with H2 to form  and
and  (Guzmán et al. 2015), follows this trend as the velocity component at −0.6 km s−1 is more prominent than that at −1.5 km s−1. The same behavior is seen for HCS+. It could indicate a difference in density and ionization fraction between these two velocity components, since the abundance of this molecular ion is expected to be higher in lower-density gas with a high electron fraction (Lucas & Liszt 2002).
Column densities and abundances.
3.2 Molecular abundances
We report in Table 2 the column densities of the detected species. Except for SiO, we use an excitation temperature of 3.3 K for deriving column densities from the integrated line opacities. As discussed in Liszt et al. (2018), at the relatively low frequencies of the Q band, collisional excitation by electrons and neutrals is effective especially for relatively long chains such as C4H or HC3N. The chosen value of the excitation temperature is derived from the two well-detected doublets of C4H, n = 4 − 3 near 38 GHz and n = 5 − 4 near 47 GHz. The CS excitation temperature derived by comparing the present observations of the J = 1 − 0 transition with earlier measurements of the J = 2 − 1 line (Lucas & Liszt 2002) is very similar to that of C4H. SiO presents a higher excitation temperature of  K, when comparing our measurements of the J = 1 − 0 line with observations of the J = 2 − 1 line near 86 GHz with the Northern Extended Millimeter Array (NOEMA) (Rybarczyk et al. 2023). For species where two velocity components are detected, we derived the total column density by combining the integrated opacities of these two components. When several transitions were available, we computed the mean column density as a weighted average of the column densities derived from each transition and used this value to compute the species abundance relative to H2. We derived abundances relative to H2 using N(H2) = 8.6 × 1020 cm−2, the column density estimated from the HCO+ absorption, along with the mean abundance for HCO+, 3 × 10⁻⁹ (Gerin et al. 2019).
Table 3 presents a selection of abundance ratios. The relative abundances of the CS isotopologs follow those of the carbon and sulfur isotopes, within the accuracy of the present measurements; namely, 12CS/13CS ~ 12C/13C and C32S/C34S ~ 32S/34S. HCS+ has a fairly high column density, similar to that of C34S. A similar value of the CS/HCS+ abundance ratio was previously found along the line of sight to 3C111 (Lucas & Liszt 2002). As discussed in Lucas & Liszt (2002), when CS/HCS+ is approximately 20, the dissociative recombinations of HCS+ ions with the abundant electrons in the diffuse gas are efficient enough to produce the observed CS abundance. Using reaction rates in the KIDA database3, the free-space photodissociation rate of CS is 10−9 s−1 and the rate of the dissociative recombination of HCS+ with electrons leading to CS is 1.80 × 10⁻⁷(T/300)−0.57 cm3s−1. By balancing the CS photodissociation by the formation through the HCS+ dissociative recombination, we get a relationship between the CS and HCS+ abundances X(CS) and X(HCS+):

The observed abundance ratio between CS and HCS+ of ~28 indicates that HCS+ can be considered a precursor of CS, as HCO+ is a precursor of CO in diffuse and translucent clouds. This raises questions on the formation pathways of these precursor molecular ions.
The species with the largest number of carbon or nitrogen atoms, C4H and HC3N, show a contrasting behavior. C4H is more abundant than C3H either in its linear (this work) or cyclic (Liszt et al. 2014) forms, a pattern seen for carbon chains in dark clouds such as TMC-1 (e.g., Oyama et al. 2020). While the CCH abundance derived by Lucas & Liszt (2000) is X(CCH) = 3.6× 10⁻⁸, C4H is about 50 times less abundant than CCH, indicating a steeper decrease in the carbon chain abundance with respect to the total number of carbon atoms compared with dark clouds where C2H/C4H is approximately 10 (Oyama et al. 2020; Liszt et al. 2018). HC3N presents a deficit with respect to carbon chains toward BL Lac, consistent with the first detection in the translucent cloud along the line of sight to 3C111 (Liszt et al. 2018), as we measure C4H/HC3N ~ 26 ± 10, while the same ratio is close to 2 in TMC-1. Similar column densities for C4H and HC3N are clearly excluded from our data, as this would imply stronger absorption features from HC3N, which would have been clearly detected at the sensitivity reached in the survey.
The most remarkable detections are those of the organic species ketene (H2CCO) and acetaldehyde (CH3CHO). These molecules reach comparable column densities of ~2 5 × 1011 cm−2 along the line of sight to BL Lac. They are about 15 times less abundant than formaldehyde. Ketene and acetaldehyde have previously been detected in dense photodissociation regions such as the Orion Bar and the Horsehead Nebula (Guzmán et al. 2014; Cuadrado et al. 2017), indicating that they can resist FUV radiation. It is interesting to note that ketene and acetaldehyde reach similar abundances in the Orion Bar and the Horsehead Nebula, about 10−10 relative to H2, a factor of 10 lower than formaldehyde along the same lines of sight. Their abundances relative to H2 along the sight line to BL Lac also reach the same level, at a few times 10−10, indicating that ketene and acetaldehyde are formed at the same efficiency in all these UV-illuminated environments. In TMC-1, ketene is about four times more abundant than acetaldehyde reaching an abundance of 1.5 × 10⁻⁹ with respect to H2 (Cernicharo et al. 2020). The abundance of acetaldehyde appears remarkably uniform in these different environments, remaining at a level of ~3 × 10⁻¹⁰ relative to H2. With the low extinction along the sight line to BL Lac, dust grains are not expected to host ices; hence, the most likely formation pathway must involve gas-phase chemistry. The conditions for forming ketene are more favorable in the denser and more shielded environment of TMC-1.
Selected Abundance ratios toward BL Lac.
4 Discussion
To put the sight line to BL Lac into the context of diffuse and translucent clouds, we compile the abundances of molecular species detected by the absorption lines in diffuse and translucent clouds in Table B.3. We include neutral and ionized fullerene C60 and  , as they are representative of large carbonaceous species. Both were spectroscopically identified through their absorption bands for
  (Cordiner et al. 2019), and through specific emission bands in high-resolution mid-infrared spectra of reflection nebulae for C60 and
  (Berné et al. 2013). Figure 2 presents a graphical display of the same information. As the detection methods and source samples are different for the different species, high-mass stars, radio sources, and compact HII regions, this compilation does not represent the abundance of a “typical” sight line through diffuse gas. It is meant to summarize the variety of chemical species already identified and the order of magnitude of their abundances. Some species, such as CH, OH, and CH+, can be measured using different techniques accessible both at visible and radio and/or submil-limeter wavelengths, which allows for checking the consistency of the abundance measurements for the different samples of background sources. The range of abundance variations is also indicated as a logarithmic interval. Abundance variations are ubiquitous in diffuse and translucent clouds from sight line to sight line or among velocity components along the same sight line, as the abundances are related to the detailed local physical conditions. For instance, the sight line toward NRAO 150 hosts five velocity components of similar total H2 column densities, two of which have stronger features in CS and H2CO associated with denser gas than the three other components (Gerin et al. 2024).
The new detections achieved toward BL Lac nicely fit into previous detections and confirm that relatively complex species such as C4H or acetaldehyde reach abundances relative to H2 higher than 10−10 even in the low-density, low-extinction diffuse and translucent clouds. These abundances are comparable to the abundance of neutral and ionized fullerene C60 and  (Cordiner et al. 2019; Berné et al. 2013). It is therefore tempting to bridge the gap between the small gas-phase species and the larger species known to also be present in diffuse and translucent clouds, such as polycyclic aromatic hydrocarbons (PAHs), fullerenes, and the carriers of the diffuse interstellar bands (DIBs). Recent progress on the spatial distribution of selected DIBs and their relation to the 3D structure of the interstellar medium (Lallement et al. 2024) now provides detailed information on the location of the DIB carriers with respect to the diffuse clouds and their association with either atomic or molecular gas. Some DIBs seem to be associated with diffuse molecular gas, while others better follow the lower-density atomic gas (Lallement et al. 2024). Because the extinctions are too low for ice mantles to be present, molecule formation on dust surfaces is excluded in diffuse clouds. However, the similar abundances between complex species and fullerene suggest a chemical relation. Current chemical models do not include the chemical coupling between the small gas-phase species, the PAHs, and related fullerenes, lacking detailed information on the rates and products of the potential chemical processes. Theoretical calculations of carbon atoms accreting on PAHs show that the resulting complexes after several accretion steps may host side chains that could be released in fragments of various sizes in the gas phase (Omont & Bettinger 2025). The losses of C2H and C2H2 are calculated to be important channels and could represent a significant fraction of the total formation rate of these two molecules in the diffuse molecular gas C2H and C2H2 can further be processed or react with ions and neutrals to build heavier carbon species. Accretion of oxygen atoms is also possible, although less favored than the accretion of carbon atoms. Further studies on the reactivity of PAHs and fullerenes in their neutral or ionized forms with carbon and oxygen are needed for a more quantitative assessment of the role of these species in the production of gas-phase small molecules.
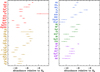 |
Fig. 2 Summary of abundances of detected species in diffuse and translucent clouds as listed in Table B.3. |
5 Summary and conclusions
We presented a deep spectral survey in the Q Band toward the bright radio source BL Lac. Thanks to the source flaring at the time of the observations, we achieved an unprecedented sensitivity on the continuum of 0.02–0.07% in 38 kHz channels. At this sensitivity, we reported new detections in the diffuse medium along the line of sight to BL Lac of CCS, C4H, CH3CHO, H2CCO, and H2CS and confirmed previous detections of C3H+, HCS+, CH3CN, and HC3N.
The abundances relative to H2 of the organics ketene and acetaldehyde are comparable to those observed in such dense photodissociation regions as the Horsehead Nebula or the Orion Bar, suggesting that similar gas-phase chemical processes could be at work in these UV-illuminated environments.
The decrease in the abundance of carbon chains with the number of carbon atoms is more marked toward BL Lac than in the dense dark cloud TMC-1. However, the same pattern of higher abundances for chains with an even number of carbon atoms with respect to chains with an odd number of carbon atoms is observed.
These observations show the potential of deep observations in the Q band for detecting complex species in the diffuse interstellar medium. Similar observations in the K band could allow for the detection of longer chains if a matched sensitivity on the continuum approaching 0.01% can be reached.
Acknowledgements
This work is based on observations carried out with the Yebes 40 m telescope (project number 24A023). The 40 m radio telescope at Yebes Observatory is operated by the Spanish Geographic Institute (IGN; Ministerio de Transportes y Movilidad Sostenible). B.T. acknowledges Spanish Ministry of Science support from grants PID2022-137980NB-100 and PID2023-147545NB-100. This research has made use of spectroscopic and collisional data from the EMAA database (https://emaa.osug.fr and https://dx.doi.org/10.17178/EMAA). EMAA is supported by the Observatoire des Sciences de l’Univers de Grenoble (OSUG). This work was supported by the program “Physique et Chimie du Milieu Interstellaire (PCMI)” funded by Centre National de la Recherche Scientifique (CNRS) and Centre National d'Etudes Spatiales (CNES). The National Radio Astronomy Observatory is operated by Associated Universities, Inc. under a cooperative agreement with the National Science Foundation.
Appendix A BL Lac continuum flux
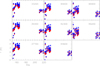 |
Fig. A.1 Variation of the continuum flux in H (red) and V (blue) polarization with time in 2024 for each spectral window. The central frequency of each spectral window in MHz is indicated in each panel. The gain varies from 3.7 Jy/K (at 32 GHz) to 4.7 Jy/K (at 48 GHz) (see https://rt48m.oan.es/). |
Figure A.1 presents the detected brightness temperature during the observations for each of the spectral backends. V-polarization measurements are shown in blue and H polarization in red. We detect a significant polarization fraction and variation of the flux across the spectral band and between the different observing days. The polarization fraction p is illustrated in Fig A.2. It is defined as  , where TV and TH correspond to the temperature in the V and H polarizations. We have also derived the brightness temperature spectral index for each continuum observation. The values are shown in Fig. A.3.
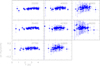 |
Fig. A.2 Variation of the polarization fraction p with observed antenna temperature. The polarization fraction is defined as |

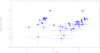 |
Fig. A.3 Variation of the spectral index of the continuum antenna temperature with the antenna temperature measured in the spectral window at the low end of the spectral range, 33.2 GHz. |
Appendix B Additional tables
This appendix presents the tables of the detected lines, Table B.1, upper limits for selected molecular transitions, Table B.2, and the compilation abundances in diffuse and translucent clouds Table B.3.
Detected lines in the Q band.
Upper limits for the selected lines in the Q band.
Molecular abundances in diffuse and translucent clouds.
References
- Agúndez, M., Marcelino, N., Tercero, B., & Cernicharo, J. 2023, A&A, 677, L13 [NASA ADS] [CrossRef] [EDP Sciences] [Google Scholar]
- Berné O. Mulas G. & Joblin C. 2013 A&A 550 L4 [NASA ADS] [CrossRef] [EDP Sciences] [Google Scholar]
- Boogert, A. C. A., Gerakines, P. A., & Whittet, D. C. B. 2015, ARA&A, 53, 541 [Google Scholar]
- Cabezas, C., Tercero, B., Agúndez, M., et al. 2021, A&A, 650, L9 [NASA ADS] [CrossRef] [EDP Sciences] [Google Scholar]
- Cernicharo, J. 2012, EAS Pub. Ser., 58, 251 [CrossRef] [EDP Sciences] [Google Scholar]
- Cernicharo, J., Marcelino, N., Agúndez, M., et al. 2020, A&A, 642, L17 [NASA ADS] [CrossRef] [EDP Sciences] [Google Scholar]
- Cernicharo, J., Agúndez, M., Cabezas, C., et al. 2021a, A&A, 656, L21 [NASA ADS] [CrossRef] [EDP Sciences] [Google Scholar]
- Cernicharo, J., Agúndez, M., Cabezas, C., et al. 2021b, A&A, 649, L15 [EDP Sciences] [Google Scholar]
- Cernicharo, J., Agúndez, M., Cabezas, C., et al. 2022, A&A, 657, L16 [NASA ADS] [CrossRef] [EDP Sciences] [Google Scholar]
- Cordiner, M. A., Linnartz, H., Cox, N. L. J., et al. 2019, ApJ, 875, L28 [NASA ADS] [CrossRef] [Google Scholar]
- Cox, P., Guesten, R., & Henkel, C. 1988, A&A, 206, 108 [NASA ADS] [Google Scholar]
- Cuadrado, S., Goicoechea, J. R., Cernicharo, J., et al. 2017, A&A, 603, A124 [NASA ADS] [CrossRef] [EDP Sciences] [Google Scholar]
- De Luca, M., Gupta, H., Neufeld, D., et al. 2012, ApJ, 751, L37 [Google Scholar]
- Endres, C. P., Schlemmer, S., Schilke, P., Stutzki, J., & Müller, H. S. P. 2016, J. Mol. Spectr., 327, 95 [NASA ADS] [CrossRef] [Google Scholar]
- Fan, H., Rocha, C. M. R., Cordiner, M., et al. 2024, A&A, 681, A6 [NASA ADS] [CrossRef] [EDP Sciences] [Google Scholar]
- Feuchtgruber, H., Helmich, F. P., van Dishoeck, E. F., & Wright, C. M. 2000, ApJ, 535, L111 [NASA ADS] [CrossRef] [Google Scholar]
- Gerin, M., Neufeld, D. A., & Goicoechea, J. R. 2016, ARA&A, 54, 181 [NASA ADS] [CrossRef] [Google Scholar]
- Gerin, M., Liszt, H., Neufeld, D., et al. 2019, A&A, 622, A26 [NASA ADS] [CrossRef] [EDP Sciences] [Google Scholar]
- Gerin, M., Liszt, H., Pety, J., & Faure, A. 2024, A&A, 686, A49 [NASA ADS] [CrossRef] [EDP Sciences] [Google Scholar]
- Godard, B., Falgarone, E., Gerin, M., et al. 2012, A&A, 540, A87 [NASA ADS] [CrossRef] [EDP Sciences] [Google Scholar]
- Godard, B., Pineau des Forêts, G., Hennebelle, P., Bellomi, E., & Valdivia, V. 2023, A&A, 669, A74 [NASA ADS] [CrossRef] [EDP Sciences] [Google Scholar]
- Gratier, P., Majumdar, L., Ohishi, M., et al. 2016, ApJS, 225, 25 [Google Scholar]
- Green, G. M., Schlafly, E., Zucker, C., Speagle, J. S., & Finkbeiner, D. 2019, ApJ, 887, 93 [NASA ADS] [CrossRef] [Google Scholar]
- Guzmán, V. V., Pety, J., Gratier, P., et al. 2014, Faraday Discuss., 168, 103 [Google Scholar]
- Guzmán, V. V., Pety, J., Goicoechea, J. R., et al. 2015, ApJ, 800, L33 [CrossRef] [Google Scholar]
- Jacob, A. M., Neufeld, D. A., Schilke, P., et al. 2022, ApJ, 930, 141 [NASA ADS] [CrossRef] [Google Scholar]
- Knauth, D. C., Andersson, B. G., McCandliss, S. R., & Warren Moos, H. 2004, Nature, 429, 636 [NASA ADS] [CrossRef] [Google Scholar]
- Lallement, R., Vergely, J. L., Babusiaux, C., & Cox, N. L. J. 2022, A&A, 661, A147 [NASA ADS] [CrossRef] [EDP Sciences] [Google Scholar]
- Lallement, R., Vergely, J. L., & Cox, N. L. J. 2024, A&A, 691, A41 [NASA ADS] [CrossRef] [EDP Sciences] [Google Scholar]
- Lis, D. C., Schilke, P., Bergin, E. A., et al. 2014, ApJ, 785, 135 [NASA ADS] [CrossRef] [Google Scholar]
- Liszt, H. S. 2020, ApJ, 897, 104 [Google Scholar]
- Liszt, H., & Gerin, M. 2023, ApJ, 943, 172 [NASA ADS] [CrossRef] [Google Scholar]
- Liszt, H., & Gerin, M. 2025, A&A, 699, A17 [NASA ADS] [CrossRef] [EDP Sciences] [Google Scholar]
- Liszt, H., & Lucas, R. 1995, A&A, 299, 847 [Google Scholar]
- Liszt, H., & Lucas, R. 2001, A&A, 370, 576 [NASA ADS] [CrossRef] [EDP Sciences] [Google Scholar]
- Liszt, H. S., & Pety, J. 2012, A&A, 541, A58 [NASA ADS] [CrossRef] [EDP Sciences] [Google Scholar]
- Liszt, H. S., Pety, J., & Lucas, R. 2008, A&A, 486, 493 [NASA ADS] [CrossRef] [EDP Sciences] [Google Scholar]
- Liszt, H., Sonnentrucker, P., Cordiner, M., & Gerin, M. 2012, ApJ, 753, L28 [NASA ADS] [CrossRef] [Google Scholar]
- Liszt, H. S., Pety, J., Gerin, M., & Lucas, R. 2014, A&A, 564, A64 [NASA ADS] [CrossRef] [EDP Sciences] [Google Scholar]
- Liszt, H., Gerin, M., Beasley, A., & Pety, J. 2018, ApJ, 856, 151 [Google Scholar]
- Lucas, R., & Liszt, H. 1994, A&A, 282, L5 [Google Scholar]
- Lucas, R., & Liszt, H. 1996, A&A, 307, 237 [NASA ADS] [Google Scholar]
- Lucas, R., & Liszt, H. S. 2000, A&A, 358, 1069 [NASA ADS] [Google Scholar]
- Lucas, R., & Liszt, H. S. 2002, A&A, 384, 1054 [NASA ADS] [CrossRef] [EDP Sciences] [Google Scholar]
- Monje, R. R., Lis, D. C., Roueff, E., et al. 2013, ApJ, 767, 81 [Google Scholar]
- Müller, H. S. P., Schlöder, F., Stutzki, J., & Winnewisser, G. 2005, J. Mol. Struc., 742, 215 [Google Scholar]
- Nash, A. G. 1990, ApJS, 72, 303 [NASA ADS] [CrossRef] [Google Scholar]
- Neufeld, D. A., Black, J. H., Gerin, M., et al. 2015a, ApJ, 807, 54 [CrossRef] [Google Scholar]
- Neufeld D. A. Godard B., Gerin M. et al. 2015b A&A 577 A49 [NASA ADS] [CrossRef] [EDP Sciences] [Google Scholar]
- Omont, A., & Bettinger, H. F. 2025, A&A, 696, A180 [NASA ADS] [CrossRef] [EDP Sciences] [Google Scholar]
- Oyama, T., Ozaki, H., Sumiyoshi, Y., et al. 2020, ApJ, 890, 39 [NASA ADS] [CrossRef] [Google Scholar]
- Persson, C. M., De Luca, M., Mookerjea, B., et al. 2012, A&A, 543, A145 [NASA ADS] [CrossRef] [EDP Sciences] [Google Scholar]
- Persson, C. M., Olofsson, A. O. H., Le Gal, R., et al. 2016, A&A, 586, A128 [NASA ADS] [CrossRef] [EDP Sciences] [Google Scholar]
- Pickett, H. M., Poynter, R. L., Cohen, E. A., et al. 1998, J. Quant. Spec. Radiat. Transf., 60, 883 [Google Scholar]
- Polehampton, E. T., Menten, K. M., Brünken, S., Winnewisser, G., & Baluteau, J. P. 2005, A&A, 431, 203 [NASA ADS] [CrossRef] [EDP Sciences] [Google Scholar]
- Rybarczyk, D. R., Stanimirovic, S., & Gusdorf, A. 2023, ApJ, 950, 52 [NASA ADS] [CrossRef] [Google Scholar]
- Schilke, P., Neufeld, D. A., Müller, H. S. P., et al. 2014, A&A, 566, A29 [NASA ADS] [CrossRef] [EDP Sciences] [Google Scholar]
- Sheffer, Y., Rogers, M., Federman, S. R., et al. 2008, ApJ, 687, 1075 [Google Scholar]
- Snow, T. P., & McCall, B. J. 2006, ARA&A, 44, 367 [NASA ADS] [CrossRef] [Google Scholar]
- Sonnentrucker, P., Wolfire, M., Neufeld, D. A., et al. 2015, ApJ, 806, 49 [NASA ADS] [CrossRef] [Google Scholar]
- Tercero, F., López-Pérez, J. A., Gallego, J. D., et al. 2021, A&A, 645, A37 [EDP Sciences] [Google Scholar]
- Valdivia, V., Godard, B., Hennebelle, P., et al. 2017, A&A, 600, A114 [NASA ADS] [CrossRef] [EDP Sciences] [Google Scholar]
- Visser, R., van Dishoeck, E. F., & Black, J. H. 2009, A&A, 503, 323 [NASA ADS] [CrossRef] [EDP Sciences] [Google Scholar]
- Wakelam, V., Herbst, E., Loison, J. C., et al. 2012, ApJS, 199, 21 [Google Scholar]
- Weselak, T., Galazutdinov, G. A., Beletsky, Y., & Krełowski, J. 2010, MNRAS, 402, 1991 [NASA ADS] [CrossRef] [Google Scholar]
Q-band Ultrasensitive Inspection Journey to the Obscure TMC-1 Environment.
All Tables
All Figures
|
Fig. 1 Absorption lines detected toward BL Lac in the Q band. All spectra are normalized by the continuum and shifted vertically for clarity. The fainter lines are scaled as indicated. For comparison, we also show the absorption lines of HCO+ (J = 1 − 0) (Lucas & Liszt 1996), HCN (J = 1 − 0) (Liszt & Lucas 2001), and c-C3H2 ( |
| In the text | |
|
Fig. 2 Summary of abundances of detected species in diffuse and translucent clouds as listed in Table B.3. |
| In the text | |
|
Fig. A.1 Variation of the continuum flux in H (red) and V (blue) polarization with time in 2024 for each spectral window. The central frequency of each spectral window in MHz is indicated in each panel. The gain varies from 3.7 Jy/K (at 32 GHz) to 4.7 Jy/K (at 48 GHz) (see https://rt48m.oan.es/). |
| In the text | |
|
Fig. A.2 Variation of the polarization fraction p with observed antenna temperature. The polarization fraction is defined as |
| In the text | |
|
Fig. A.3 Variation of the spectral index of the continuum antenna temperature with the antenna temperature measured in the spectral window at the low end of the spectral range, 33.2 GHz. |
| In the text | |
Current usage metrics show cumulative count of Article Views (full-text article views including HTML views, PDF and ePub downloads, according to the available data) and Abstracts Views on Vision4Press platform.
Data correspond to usage on the plateform after 2015. The current usage metrics is available 48-96 hours after online publication and is updated daily on week days.
Initial download of the metrics may take a while.