Fig. 3
Download original image
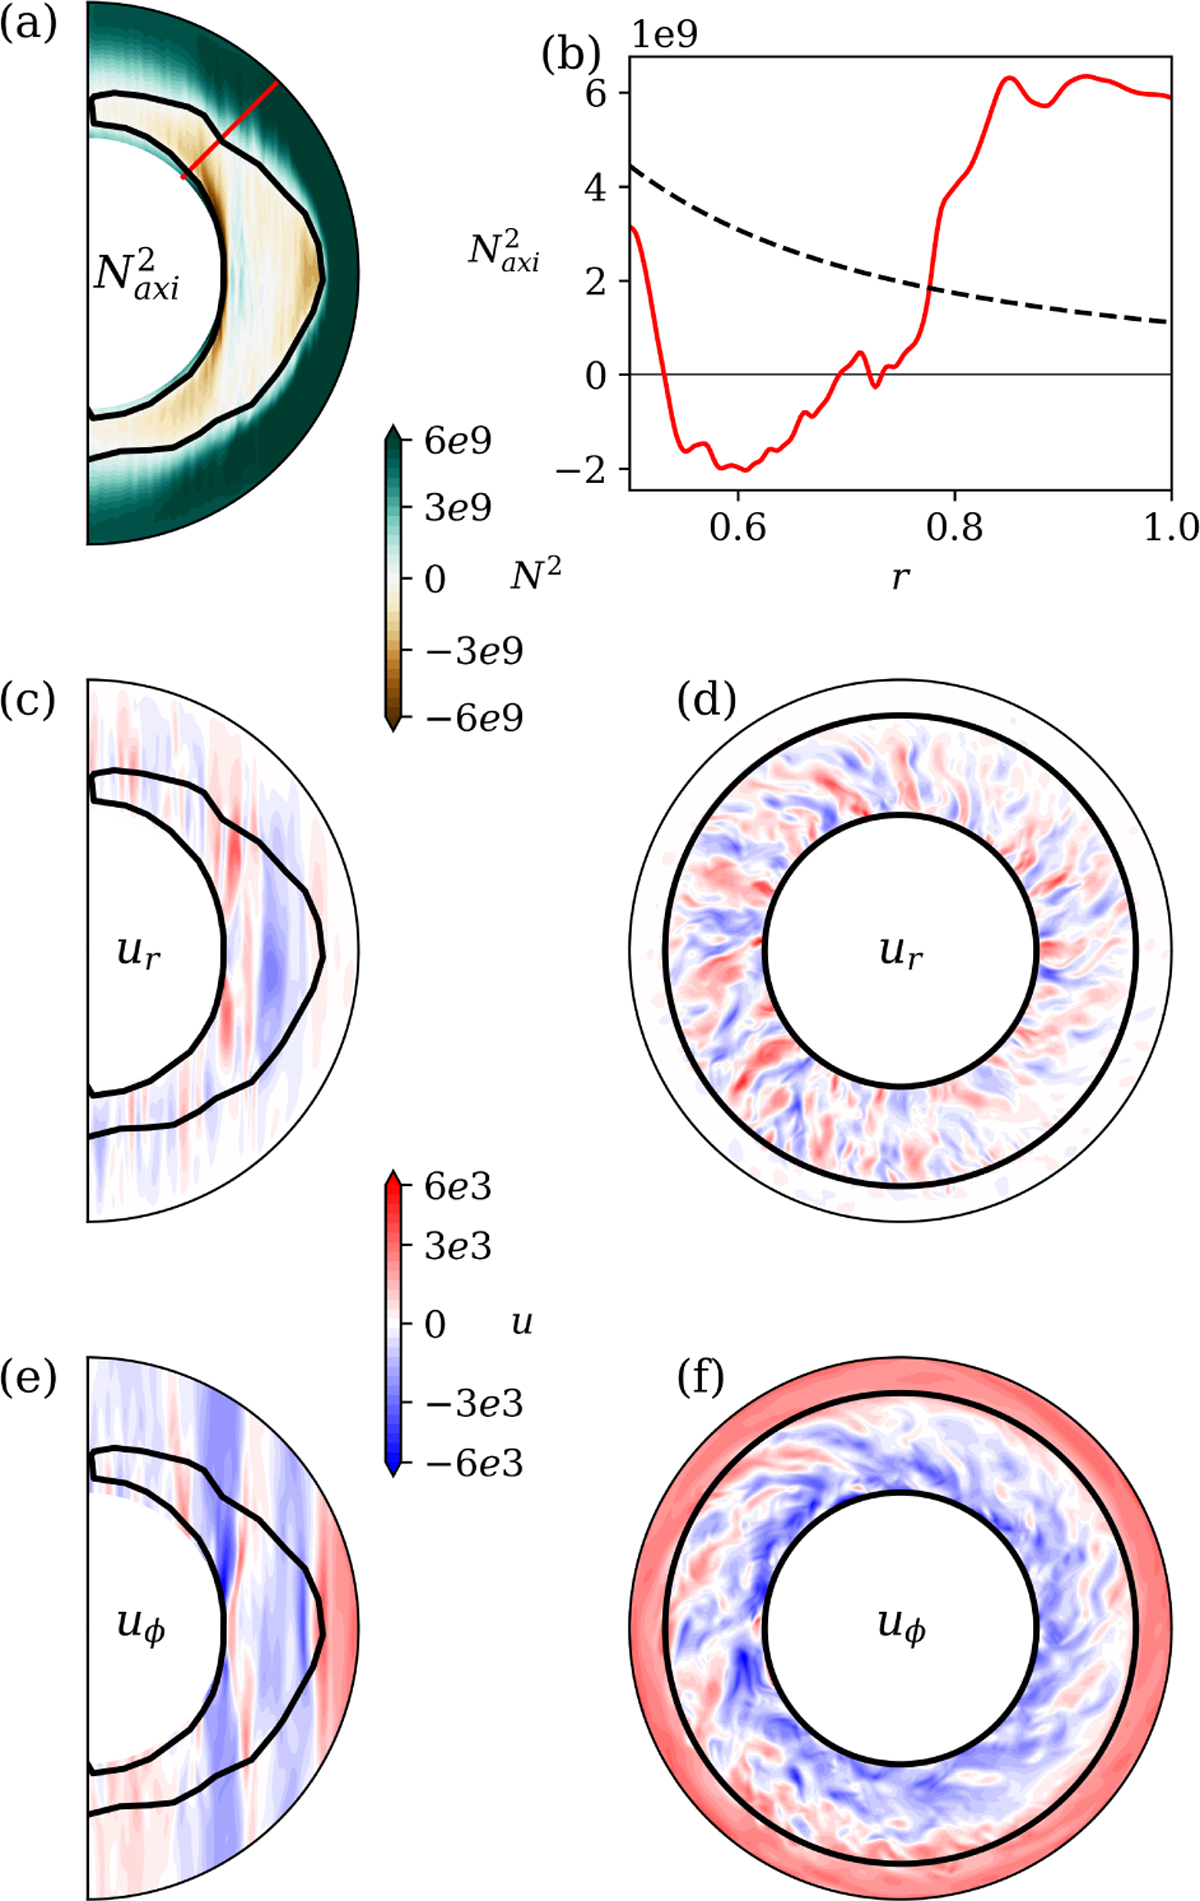
Initial condition for the main simulation, showing the axisymmetric part ![]() of the square of the Brunt-Väisälä frequency N2 (a) in a meridional slice and (b) along the transect shown in red in (a). The black dashed line shows the background conductive state. (c–f) Meridional and equatorial slices of the radial and azimuthal velocity fields ur and uϕ. The solid black lines on the snapshots show the boundaries of the convective region, where
of the square of the Brunt-Väisälä frequency N2 (a) in a meridional slice and (b) along the transect shown in red in (a). The black dashed line shows the background conductive state. (c–f) Meridional and equatorial slices of the radial and azimuthal velocity fields ur and uϕ. The solid black lines on the snapshots show the boundaries of the convective region, where ![]()
Current usage metrics show cumulative count of Article Views (full-text article views including HTML views, PDF and ePub downloads, according to the available data) and Abstracts Views on Vision4Press platform.
Data correspond to usage on the plateform after 2015. The current usage metrics is available 48-96 hours after online publication and is updated daily on week days.
Initial download of the metrics may take a while.