Open Access
Fig. 1.
Download original image
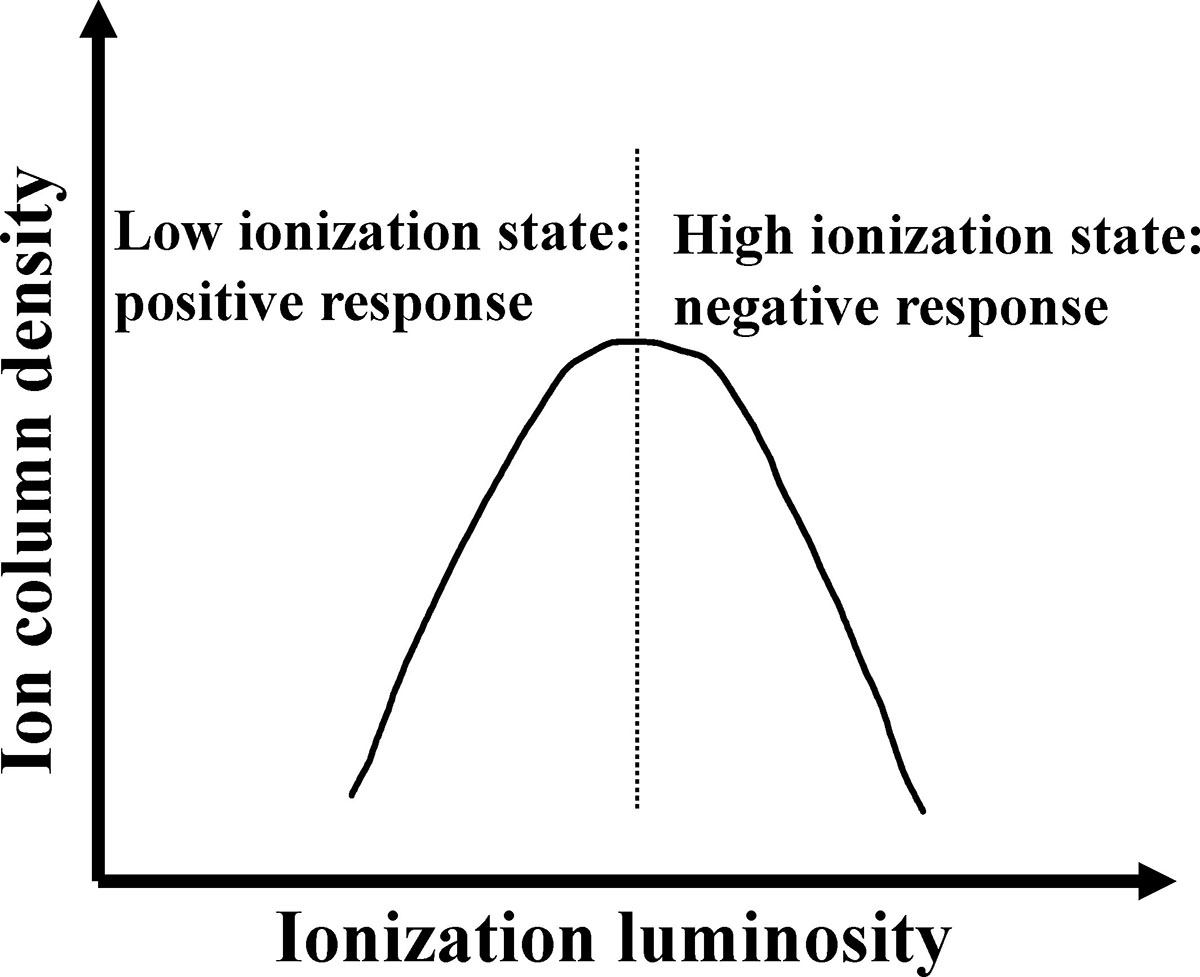
Schematic diagram of the variation in the ion column density with ionization luminosity. The column density of a specific ion in the plasma initially increases to a peak and then decreases with the rise in ionization level. The vertical dashed line represents the peak position.
Current usage metrics show cumulative count of Article Views (full-text article views including HTML views, PDF and ePub downloads, according to the available data) and Abstracts Views on Vision4Press platform.
Data correspond to usage on the plateform after 2015. The current usage metrics is available 48-96 hours after online publication and is updated daily on week days.
Initial download of the metrics may take a while.