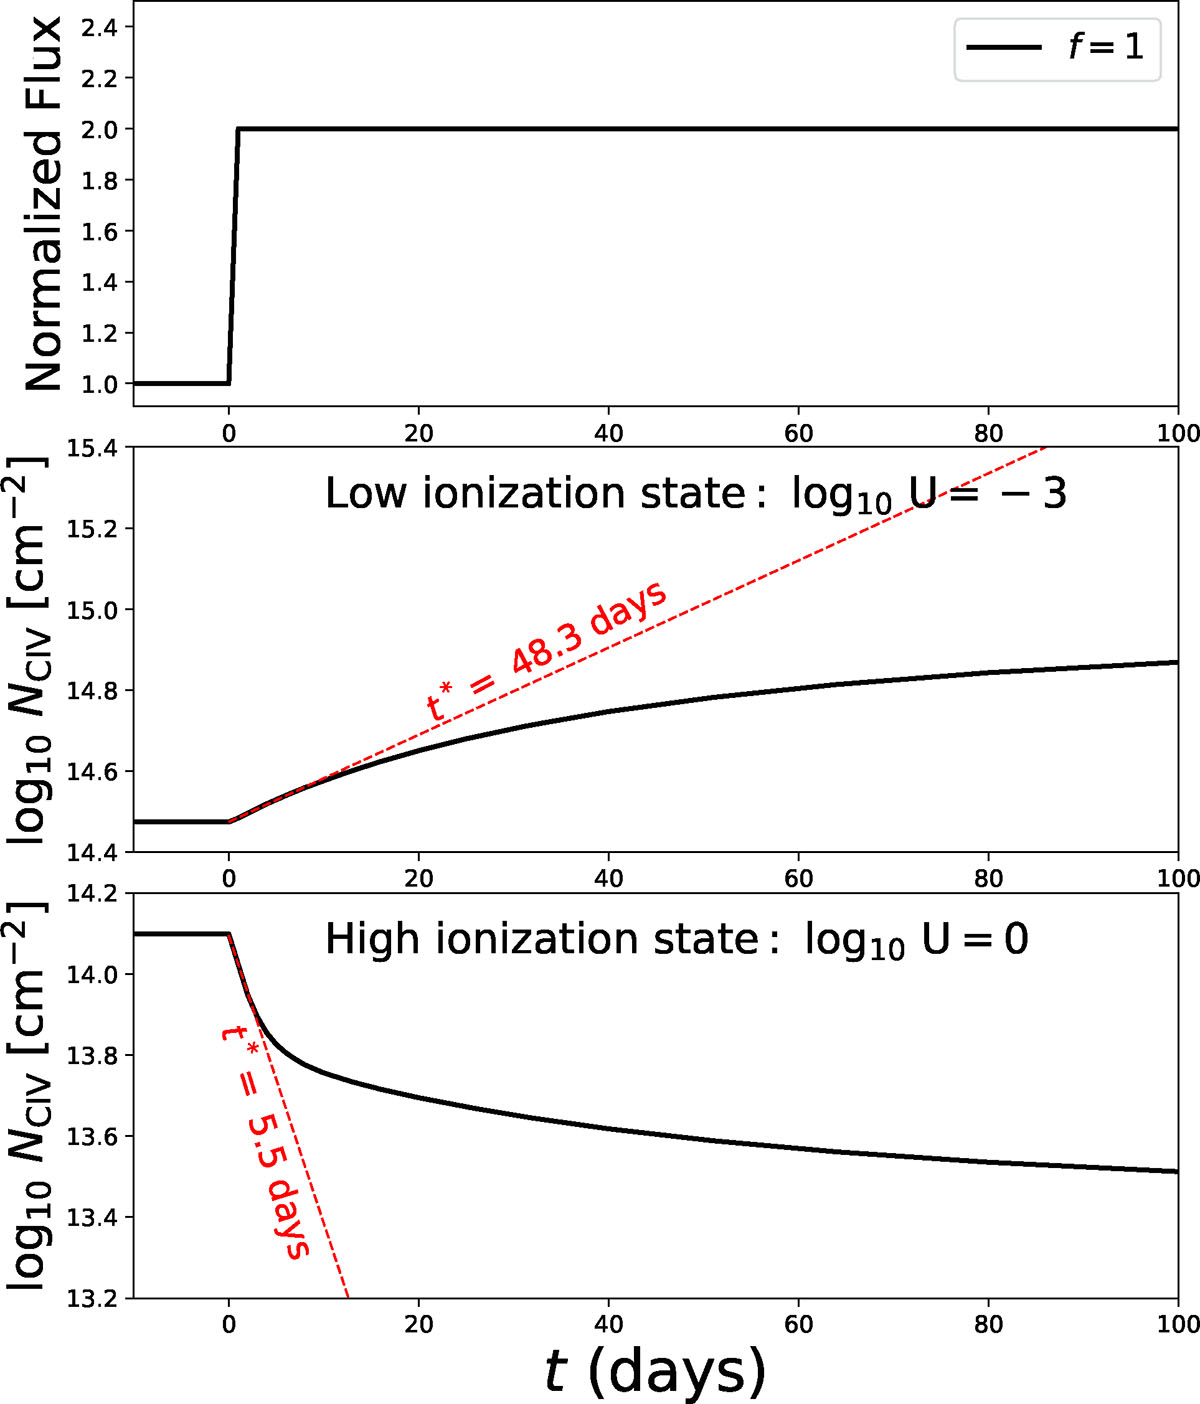
Fig. 6.
Download original image
Time-dependent photoionization simulations for the case of the light curve of the step function. At t = 0, the radiation flux is suddenly increased from 1 to 2, corresponding to a change amplitude of f = 1. This leads to a positive response in the low-ionization state (log10U = −3) and a negative response in the high-ionization state (log10U = 0). The dashed red lines represent the response timescales at the initial time predicted by Equation (11). The response timescales for log10U = −3 and log10U = 0 are 48.3 days and 5.5 days, respectively, indicating that the C IV concentration evolves more rapidly at higher ionization (log10U = 0).
Current usage metrics show cumulative count of Article Views (full-text article views including HTML views, PDF and ePub downloads, according to the available data) and Abstracts Views on Vision4Press platform.
Data correspond to usage on the plateform after 2015. The current usage metrics is available 48-96 hours after online publication and is updated daily on week days.
Initial download of the metrics may take a while.