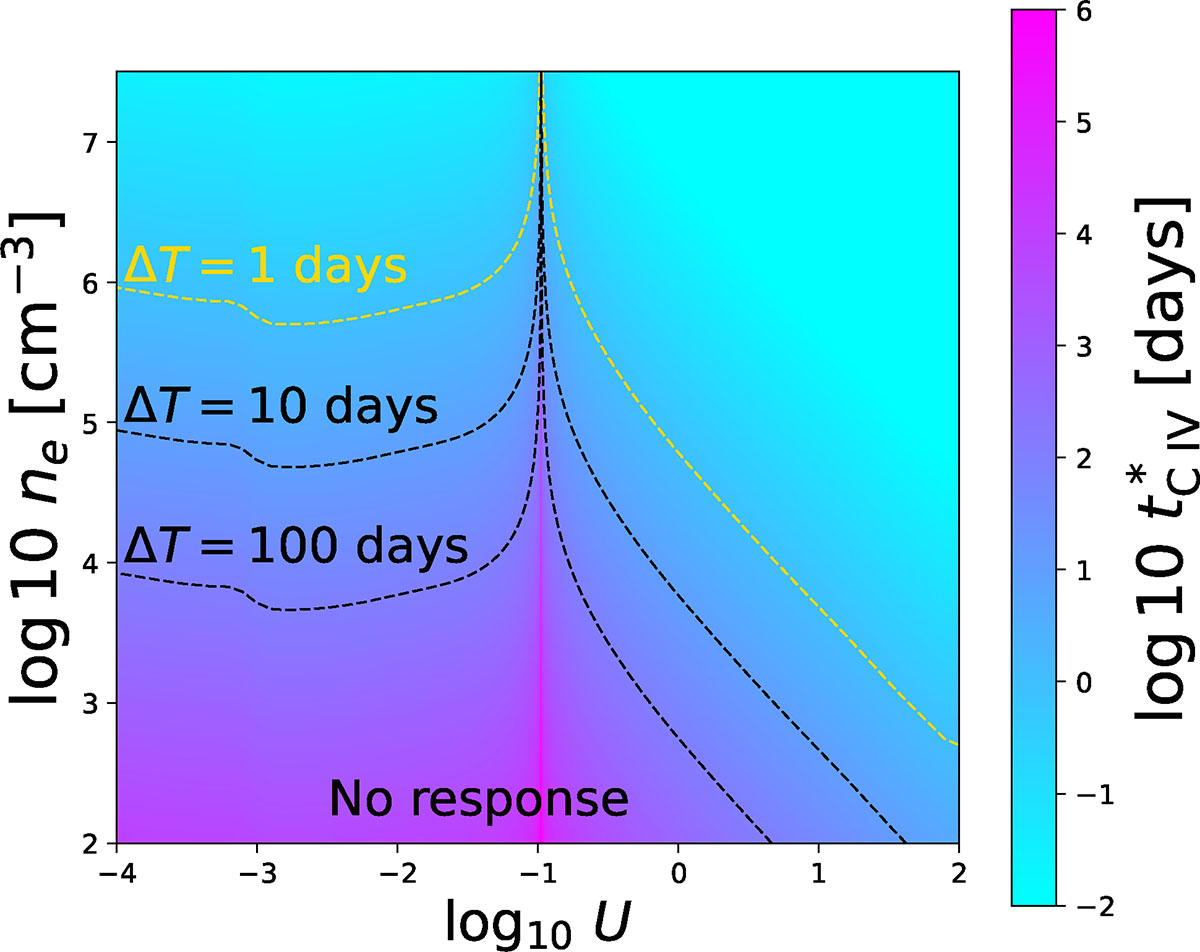
Fig. 8.
Download original image
Map of C IV response timescales on the plane of the ionization parameter and the gas density. The dashed lines represent contours that correspond to observation intervals ΔT of 1, 10, and 100 days. The dashed gold line marks one day, which is the typical minimum time interval of SDSS observations. Below each contour, the observation interval is shorter than the response timescale, indicating a nonresponsive region in which no ion concentration changes can be detected.
Current usage metrics show cumulative count of Article Views (full-text article views including HTML views, PDF and ePub downloads, according to the available data) and Abstracts Views on Vision4Press platform.
Data correspond to usage on the plateform after 2015. The current usage metrics is available 48-96 hours after online publication and is updated daily on week days.
Initial download of the metrics may take a while.