Fig. 4
Download original image
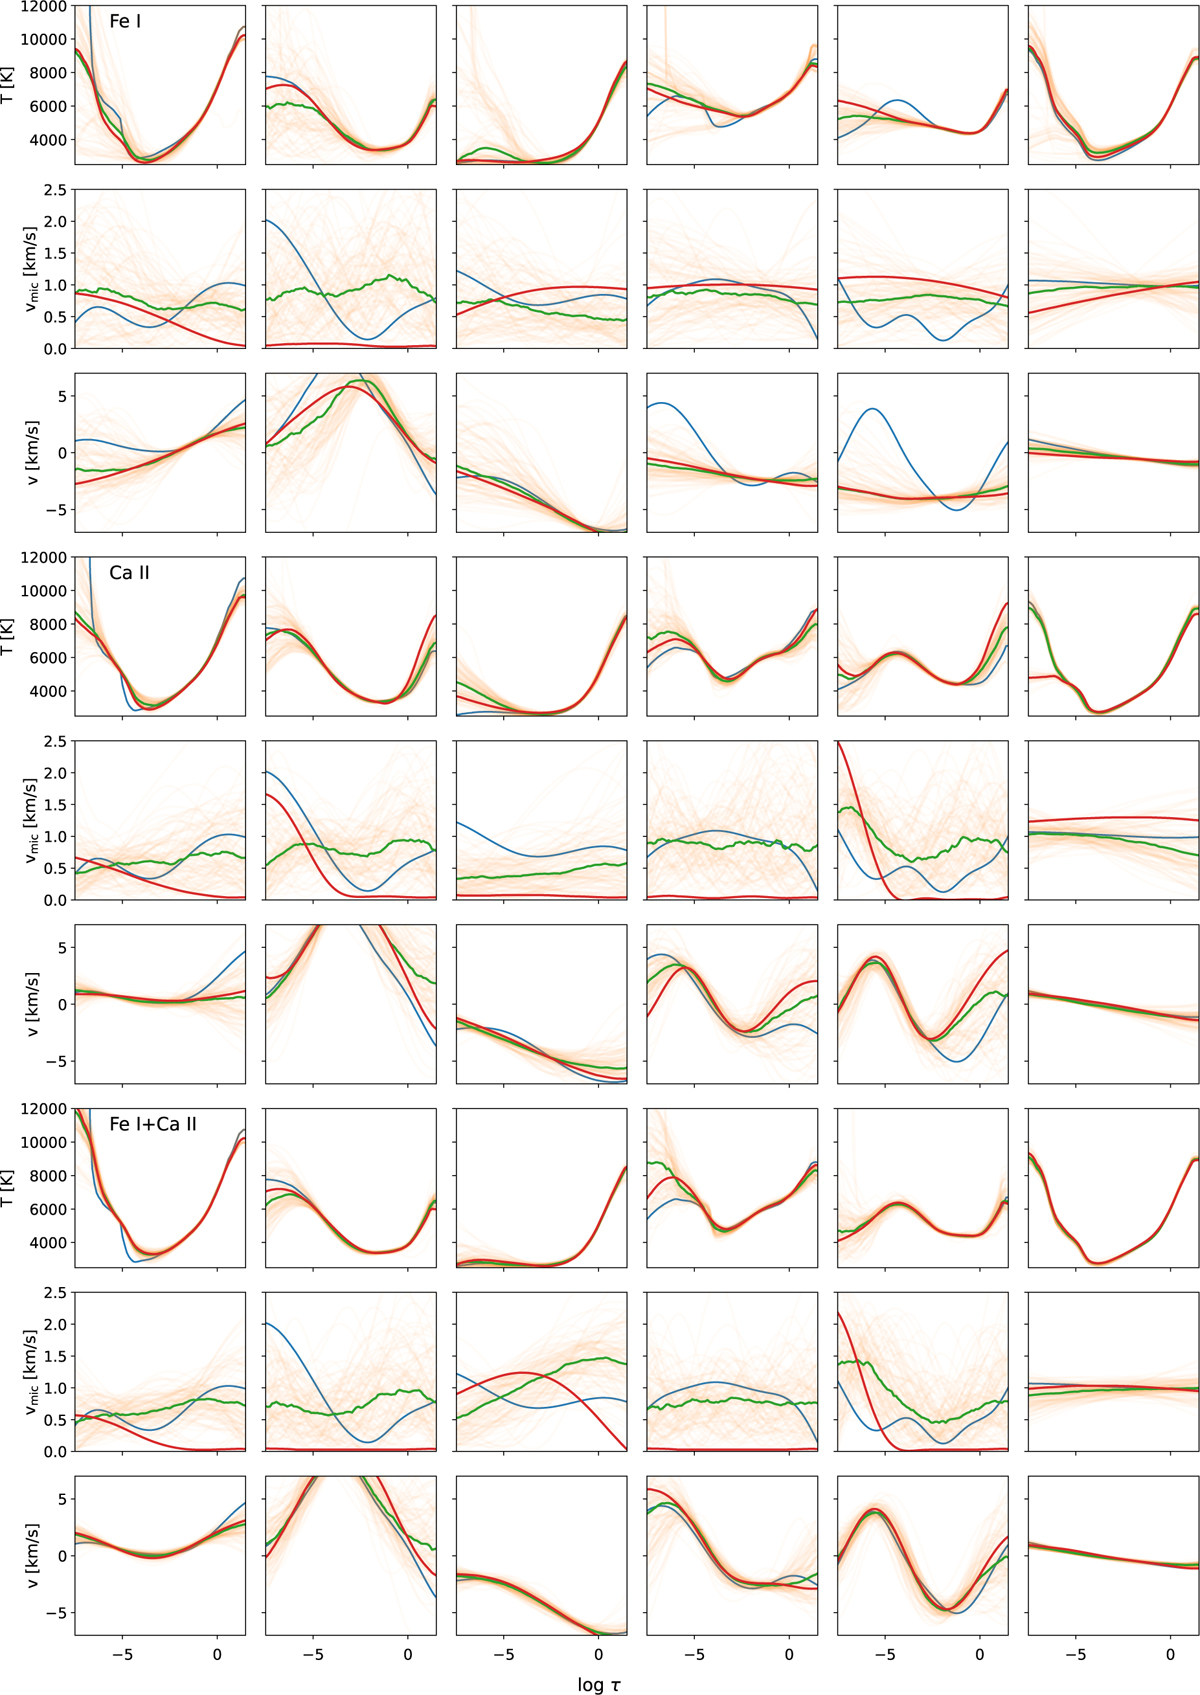
Samples from the generative model (orange curves) for the inversion of six Stokes profiles extracted from the test set. The blue curve shows the original model, the green curve shows the median model, and the red curve shows the greedy decoded model. The upper three rows show the results when the Fe I spectral region was used, the middle three rows show the results when the Ca II spectral region was used, and the last three rows show the results when both spectral regions were used.
Current usage metrics show cumulative count of Article Views (full-text article views including HTML views, PDF and ePub downloads, according to the available data) and Abstracts Views on Vision4Press platform.
Data correspond to usage on the plateform after 2015. The current usage metrics is available 48-96 hours after online publication and is updated daily on week days.
Initial download of the metrics may take a while.