Open Access
Fig. 8
Download original image
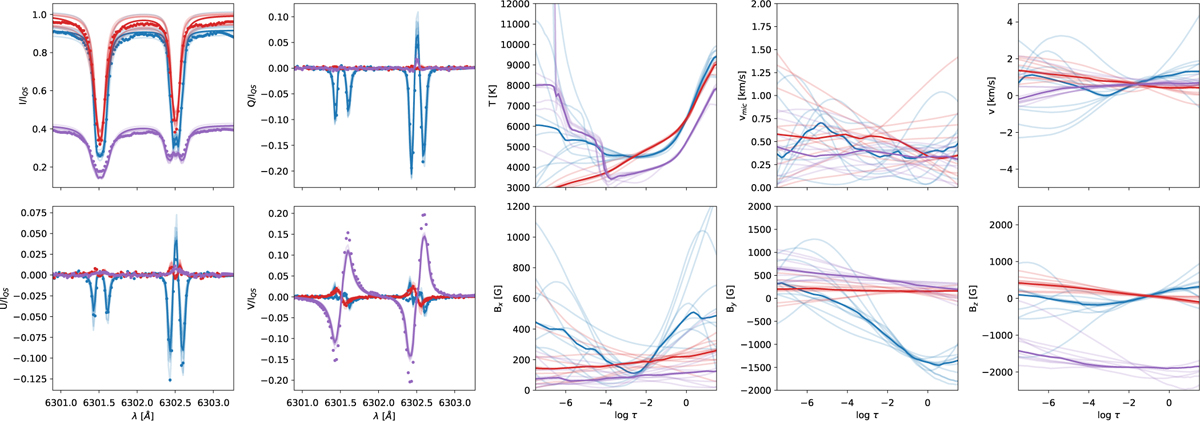
Synthesis of the Stokes profiles in the models inferred by SENTIS in the three pixels marked in Fig. 7. The dots indicate the observed Stokes profiles, the semitransparent curves show the samples from the generative model, and the solid curves show the median of the samples. The colors correspond to the symbols in Fig. 7.
Current usage metrics show cumulative count of Article Views (full-text article views including HTML views, PDF and ePub downloads, according to the available data) and Abstracts Views on Vision4Press platform.
Data correspond to usage on the plateform after 2015. The current usage metrics is available 48-96 hours after online publication and is updated daily on week days.
Initial download of the metrics may take a while.