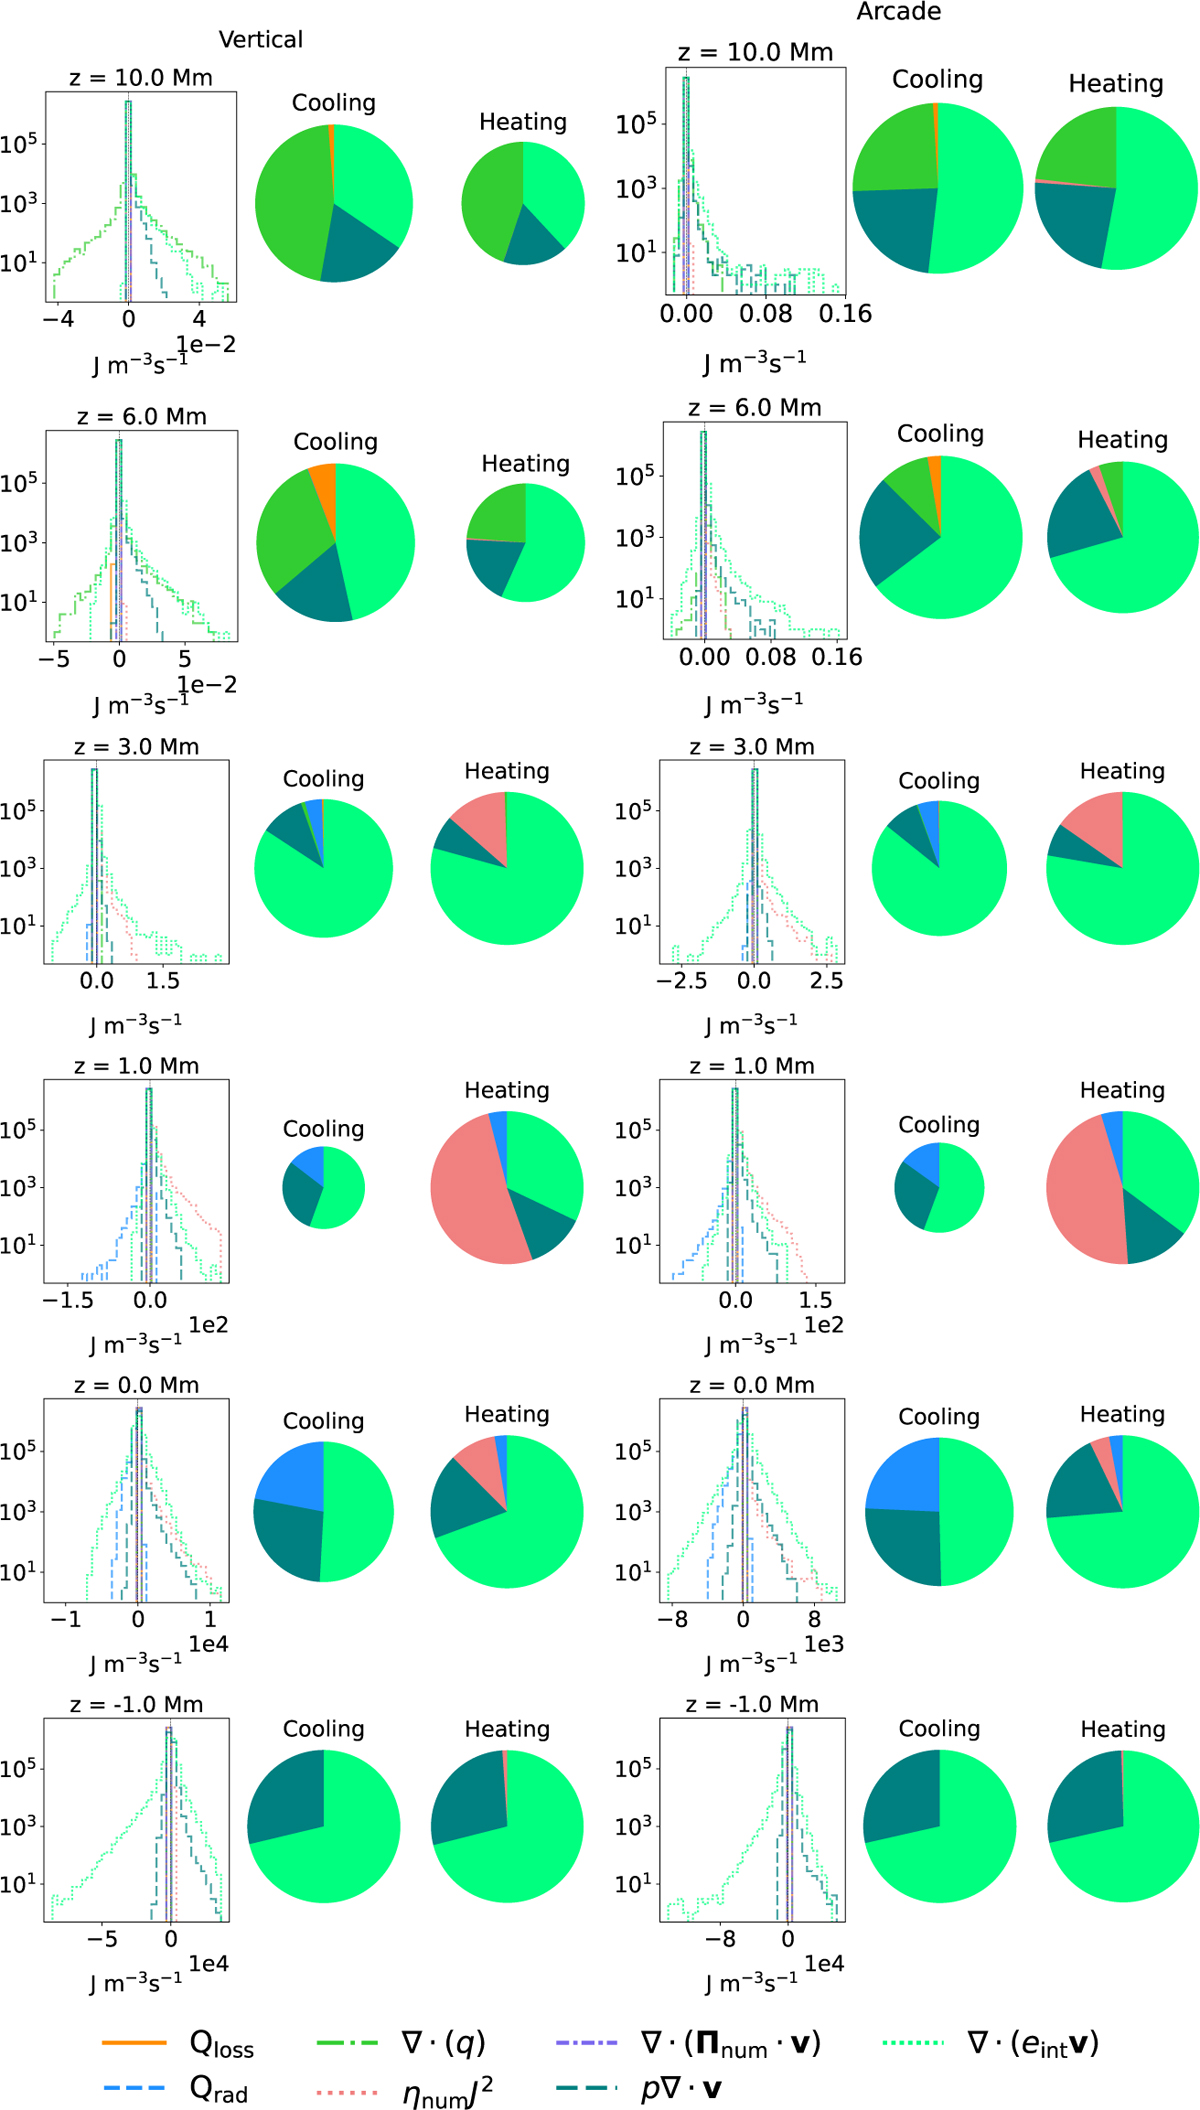
Fig. A.1
Download original image
Graphical analysis of the heating and cooling terms from Figure 10 at selected heights. Histograms and pie charts represent the contributions of the heating and cooling terms in the internal energy equation at z = 10, 6, 3, 1, 0, −1 Mm. The left column of plots corresponds to the simulation with a vertical magnetic field, and the right column to the simulation with an arcade-like magnetic field. Each histogram is accompanied by two pie charts illustrating the relative contributions of the individual terms to the total heating and cooling.
Current usage metrics show cumulative count of Article Views (full-text article views including HTML views, PDF and ePub downloads, according to the available data) and Abstracts Views on Vision4Press platform.
Data correspond to usage on the plateform after 2015. The current usage metrics is available 48-96 hours after online publication and is updated daily on week days.
Initial download of the metrics may take a while.