Fig. 2
Download original image
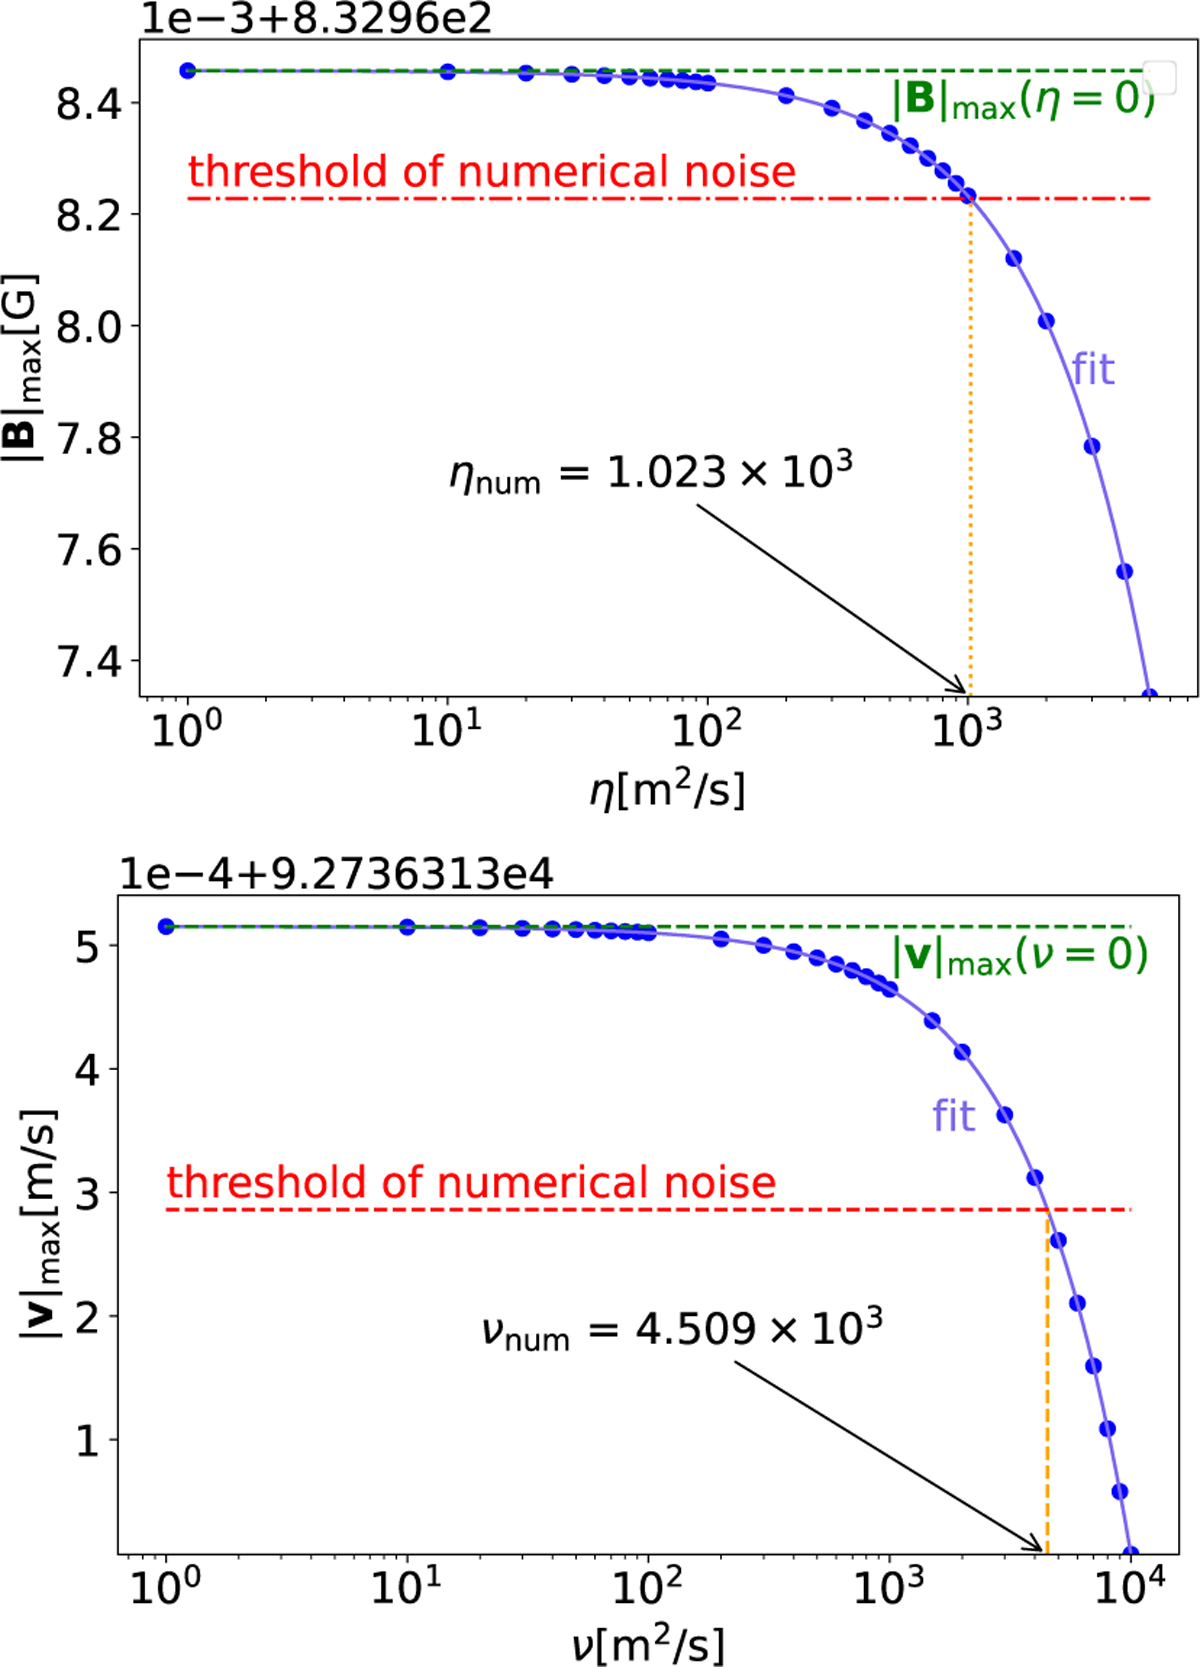
Graphical estimation of numerical resistivity (top panel) and numerical viscosity (bottom panel). Each dot represents the maximum magnetic field (Bmax) or velocity (Vmax) obtained from a simulation with a specific explicit value of η or ν. The blue solid line is a fit to these data points. Two horizontal lines are shown: one corresponds to the Bmax/Vmax value for the case with η = 0 and ν = 0, and the other marks the threshold of numerical noise. The intersection of this threshold with the fitted curve defines the estimated numerical resistivity or viscosity, indicated by the vertical line.
Current usage metrics show cumulative count of Article Views (full-text article views including HTML views, PDF and ePub downloads, according to the available data) and Abstracts Views on Vision4Press platform.
Data correspond to usage on the plateform after 2015. The current usage metrics is available 48-96 hours after online publication and is updated daily on week days.
Initial download of the metrics may take a while.