Fig. 7
Download original image
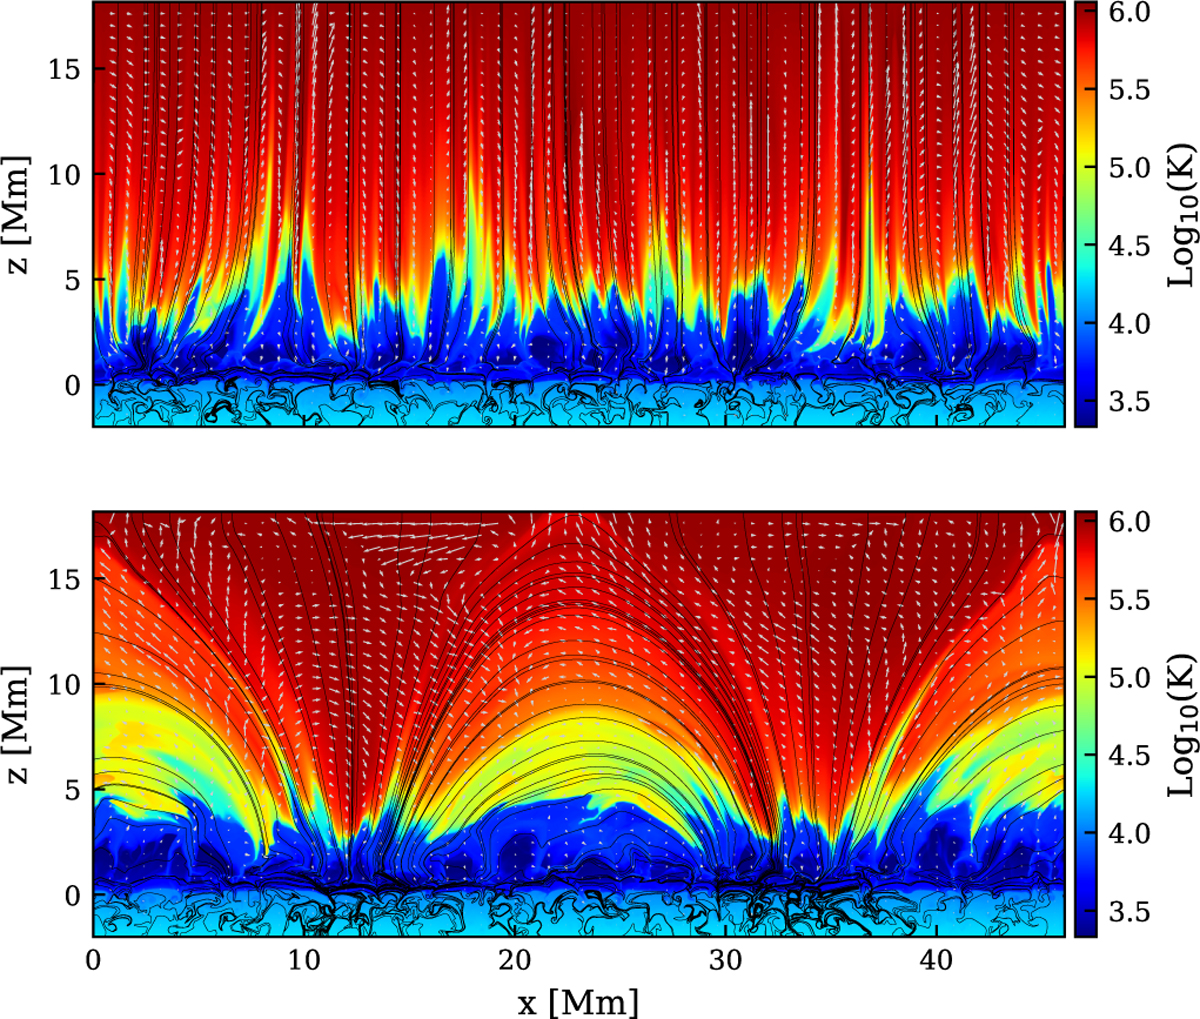
Color map of the logarithmic temperature distribution after 1 hour of solar time. The top panel shows the simulation with a vertical magnetic field (Simulation 2), and the bottom panel shows the simulation with an arcade-like magnetic field (Simulation 3). The arrows indicate the velocity field, with lengths proportional to the local flow speed, bthe blacklines are magnetic field lines.
Current usage metrics show cumulative count of Article Views (full-text article views including HTML views, PDF and ePub downloads, according to the available data) and Abstracts Views on Vision4Press platform.
Data correspond to usage on the plateform after 2015. The current usage metrics is available 48-96 hours after online publication and is updated daily on week days.
Initial download of the metrics may take a while.