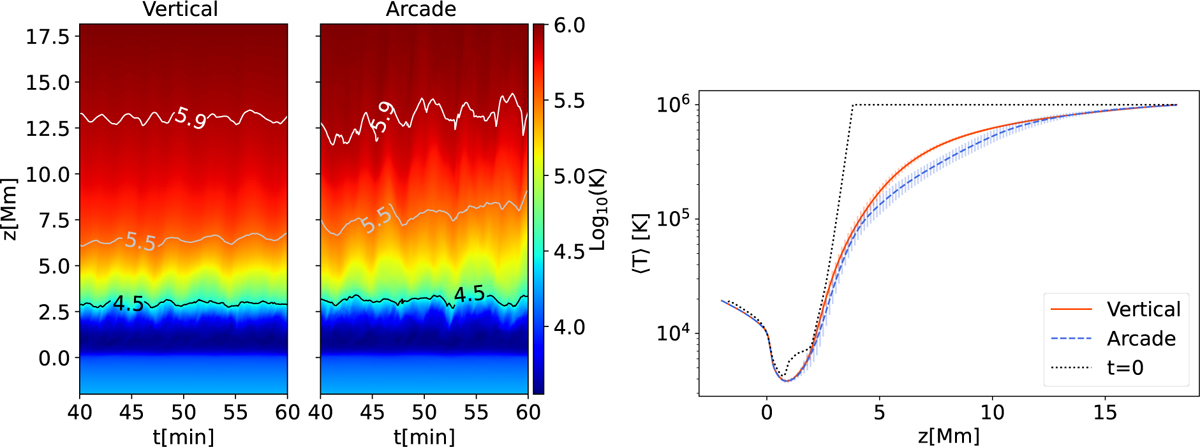
Fig. 8
Download original image
Horizontally averaged temperature profiles for the simulations shown in Fig. 7 for the last 20 minutes. The left panel displays the horizontally averaged temperature as a function of height and time, with contour lines overlaid to highlight specific temperature values. The right panel shows the temperature averaged both horizontally and over time. The black dotted line indicates the initial profile.
Current usage metrics show cumulative count of Article Views (full-text article views including HTML views, PDF and ePub downloads, according to the available data) and Abstracts Views on Vision4Press platform.
Data correspond to usage on the plateform after 2015. The current usage metrics is available 48-96 hours after online publication and is updated daily on week days.
Initial download of the metrics may take a while.