Fig. D.1
Download original image
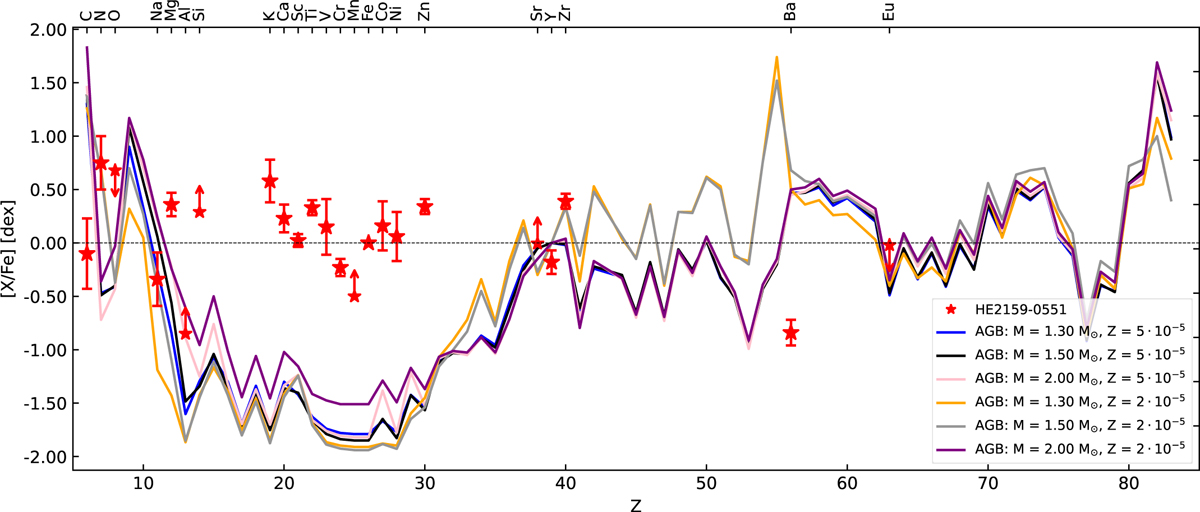
F.R.U.I.T.Y. models (Cristallo et al. 2011) in comparison to the derived abundances of HE2159-0551 (red stars). The upper and lower limits are represented as downward and upward facing arrows, respectively. The different colors represent different masses and metallicities. The horizontal dotted line shows [X/Fe] = 0.00 dex. For all models, we assume [α/Fe] = 0.50 dex and set [Y/Fe] = 0.00 dex.
Current usage metrics show cumulative count of Article Views (full-text article views including HTML views, PDF and ePub downloads, according to the available data) and Abstracts Views on Vision4Press platform.
Data correspond to usage on the plateform after 2015. The current usage metrics is available 48-96 hours after online publication and is updated daily on week days.
Initial download of the metrics may take a while.